It was a devilish quarter out there for any surviving equity bears (fittingly, the SPY closed at 666). Let’s go through a dozen charts on a monthly basis (as opposed to the more typical daily) to see what we can see.
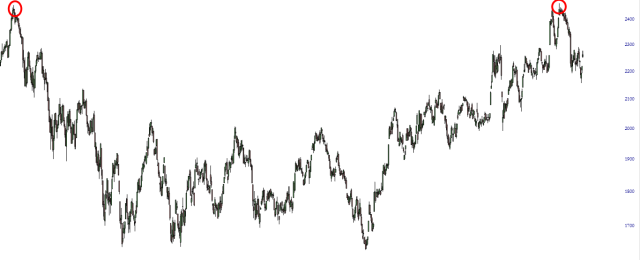
We begin with the “diamonds“, the Dow Industrial ETF, which closed at a record high. It has slightly violated its uptrend (anchored to the April 7th bottom) but, as with almost everything else, this is the fifth green monthly candle in a row.