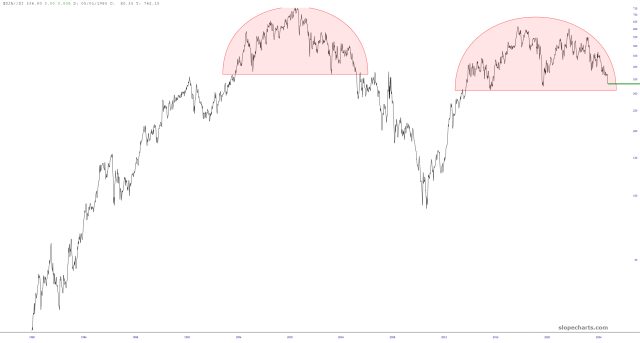
I preach the ratio charts every day. The patterns aren’t complete yet, but my GOD they are getting close, especially this first one:
Slope initially began as a blog, so this is where most of the website’s content resides. Here we have tens of thousands of posts dating back over a decade. These are listed in reverse chronological order. Click on any category icon below to see posts tagged with that particular subject, or click on a word in the category cloud on the right side of the screen for more specific choices.
I preach the ratio charts every day. The patterns aren’t complete yet, but my GOD they are getting close, especially this first one:
In my last post on Thursday 24th July I was talking about the inflection point forming here on equities and the two important possible triggers this week. The first of those was the trade deal being negotiated with the EU and that seems to have been agreed over the weekend, at a general level of 15%. This follows a similar agreement with Japan and means that trade deals in that kind of area have been agreed now with most of the largest US trading partners except China, Canada and Mexico, currently at higher levels.
This could be establishing a new normal on trade so I wanted to take a moment to review where this may be leaving us.
(more…)Back on Tuesday 3rd June I laid out a possible bullish scenario in which I was looking for retests of the all time highs on SPX and NDX, with follow-on targets if both ran higher, a retest of the all time high on INDU, and a possible longer shot retest of the all time high on IWM based on a large IHS. Since then we have seen all three of those new all time highs on SPX, NDX and INDU, and the IHS on IWM has broken up hard and made it slightly less than halfway to the target at a retest of that all time high.
What we haven’t seen yet is the further extension to the possible trendline targets that I was looking at on SPX into the 6450-6500 area, or on NDX into the 24000-24500 area, or the new all time high on IWM of course, but I think this rally is likely now very close to at minimum to a steep retracement and may currently be making the highest highs that we will see in 2025.
(more…)This is my first public post on the US Dollar possibly since 2012, so it will be lengthier than normal as it will also act as a reference post that I can refer back to every time I do an update on USD here in the future.
I’ve always really enjoyed doing the long term charts on the US Dollar. Longer term patterns can take decades to form, with the falling wedge that broke up in 2014 breaking a wedge resistance trendline coming from a high in 1985.
Even the shorter term patterns within these larger patterns can take many years to form. On the monthly chart below I was noting in April 2012 that the rising megaphone that formed in the 90’s took six years to form, and the current rising megaphone on USD has been forming since the big low in 2008, which was the lowest low going back as far as my data extends to the dying days of the gold standard in 1970.
(more…)In my posts on 3rd June and on 11th June I was putting the case for retests of the all time highs on SPX and QQQ, and potentially also on DIA and IWM. In the event that equity indices went higher from there I was also giving targets for that.
In my post on Friday 20th June I laid out a possible short term retracement scenario that I said I didn’t like but was potentially on the cards, and that didn’t happen, despite the US joining the war against Iran over the weekend.
Since the weekend that modest bearish scenario has collapsed, SPX and QQQ have made new highs for June, oil futures fell an amazing $14 from high to low yesterday as fears of an extended conflict in the Middle East receded.
(more…)