Best Buy (BBY) eventually survived Circuit City and Barnes & Noble (BKS) survived Borders.
When Borders filed for Chapter 11 bankruptcy protection in February, I started thinking about the dynamic: two or three competitors, with tight (or tightening) margins, struggling for survival in a crummy economy. Essentially, I’m looking for specific weakness and betting against whoever I think will most likely die.
The retail office product space looks to fit well into this model. Staples (SPLS), Office Depot (ODP) and OfficeMax (OMX) all took a severe beating in the 2008 drop.
They survived, but performance was poor compared to the S&P.
Since I have a Staples and an Office Depot in town, I actually investigated both stores. Been to Staples a bunch of times for the usual stuff, but I was more interested in the competition. I have one word for Office Depot: grim. Product selection appeared significantly more limited and some of what was there was actually dusty; all with the help from a staff energized like they’re expecting either a reduction-in-force or a physical beating at any minute; so I went short ODP in March.
If I was inclined to put on a pairs trade, it would be long Staples and short Office Depot. Good thing I was waiting for earnings to come out before going long Staples- as of yesterday, they reported much lower-than-expected quarterly earnings and slashed its full-year forecast, sending shares in the world's largest office supplies retailer down the most in a day in 11 years and renewing talk of consolidation (Staples shares fall after profit outlook cut). As expected, Staples got hit for -15%, OfficeMax for -7.7% and Office Depot for -5.45%. I feel a little better putting the 2nd half of the pairs trade on sometime over the next few weeks- at a much lower price.
Today, Oppenheimer cut its rating on Staples and OfficeMax to "perform" from "outperform," saying sales trends for office supplies retailers appear unlikely to rebound any time soon. (Note: I think Office Depot wasn’t mentioned as they are already rated “perform” on 10/25/2010).
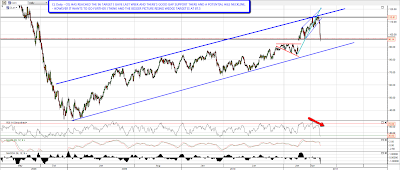
Technically speaking, ODP remains weak:
Over the long haul, chances are Staples will be a (the?) survivor and I see Office Depot as the weakest of the three with the greatest fundamental challenges.