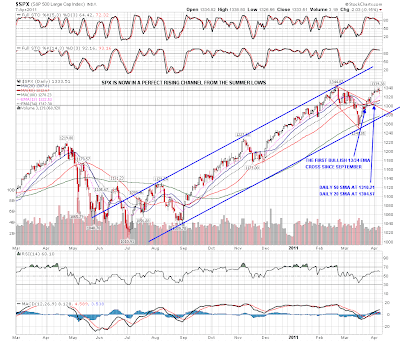
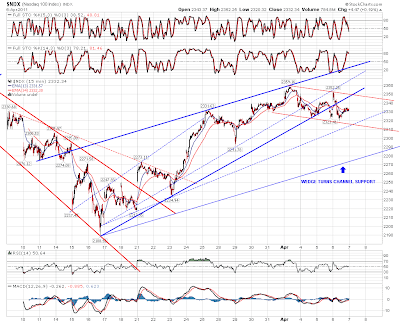
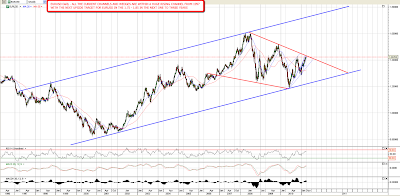
What a wild week. The bearish push down on Monday accompanied by a series of bearish trendline breaks has been followed by an even stronger push up, and as I write ES has peaked almost ten points above the 1319 level that held as resistance on Friday. The short side isn't quite dead in the water yet, but they're in serious trouble, and ES is now close to a new high that should signal that we are in a new wave up. On NQ resistance on the possible diamond top is now being tested and if NQ can retake 2350 and stay above it then I'd be inclined to write this pattern off:
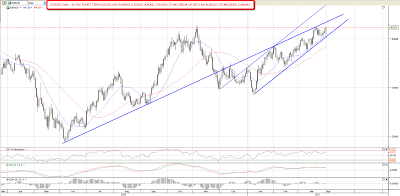
On ES the only remaining H&S pattern in play is the continuation IHS that will indicate to the 1446 area if ES can make a new high. A couple of points worth noting as well on this chart are the broadening formation that has broken up with a target at 1348, though this isn't a pattern with a strong track record, and the resistance level and trendline at 1329, which is where ES is stalling at the time of writing. We could see a reversal from this level this morning, as the ES 60min RSI is very overbought:

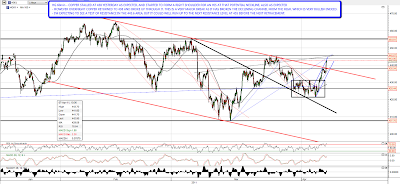
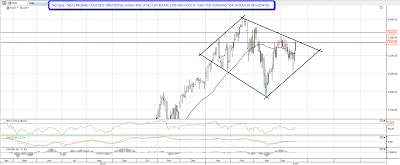
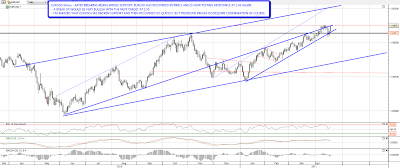
Copper has also reversed back up, though not as strongly, and I'm looking for a short term high in the 431.5 area, which is also a potential IHS neckline. A rising wedge has formed from Monday's low which supports a retracement here and the obvious target for that retracement would be the 423.5 area. A break back below 420 would look bearish and would kill off the potential IHS, though I'd be watching for a double bottom with positive divergence there:
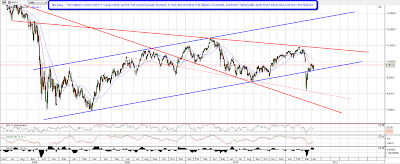
EURUSD gapped below the rising wedge trendline and then gapped back above it leaving a little island bottom on the trading hours daily chart (XEU). EURUSD is now back at 1.45 resistance and has made a marginal new high, which is very bullish. AUDUSD is also breaking up, so the outlook for USD is deteriorating very fast:
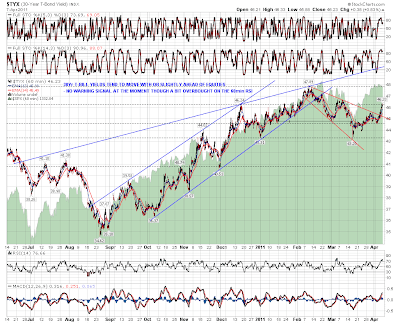
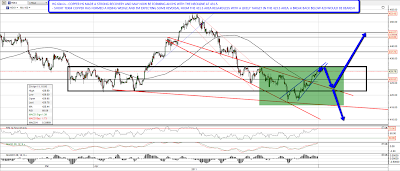
TLT consolidated above broken declining resistance yesterday, and the obvious next resistance level is 93.7. If we are seeing a major break up on equities however, then bonds are likely to struggle at best and I'd expect TLT to reverse back down. Bonds are strongly inversely correlated with equities, so I'm treating this break up with extreme caution until we see where equities are going:

I was looking through some precious metals charts yesterday, just to see how the other precious metals were doing. Platinum was interesting, as it hasn't participated in the latest stage of the PMs rally so far, though it rose very strongly from the late 2008 lows into early 2010, and is still up a lot more than gold over the same period. It looks rangebound at the moment on the weekly chart:

The really interesting chart was the weekly chart for palladium though, which has even outperformed silver from the late 2008 lows. The chart looks particularly appealing as there is a tight rising channel and a very obvious target in the 925 area. Of all the PM charts palladium looks the most compelling long at this level:

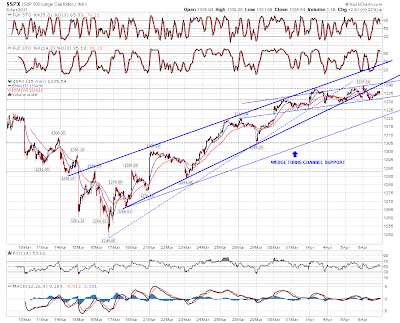
Overall on equities this reversal looks very bullish, but they're short term overbought and at serious resistance, so I'm expecting some retracement from here today. A gap fill looks very ambitious and I'd be surprised to see that. The obvious target for a retracement on ES within this bullish context would be broken resistance in the 1319 area.