Yesterday SPX respected the dismal stats for the last day of the month, and closed down three points from the previous close. Today is the first trading day of April, which is the strongest performing month on the Dow since 1955, and the trading stats for the first of the month since the March 2009 low are extremely strong, notwithstanding the bull massacre at the beginning of last month.
The most effective trading strategy over this period on the first of the month has been to go long at the close on the previous day, and sell at the close on the first trading day of the month, unless the SPX gaps down, in which case you should sell at the open as the four gaps down in the series have ended up down 14.5 points for the day on average.
A less effective strategy has been to go long at the open, unless there is a gap down from the previous close, but that would still have yielded 194 points in total since April 1st 2009, against 234 points for going long at the previous close. Here's the updated table:

The Russell 2000 had already made a new high, but yesterday the Transports index also closed above the previous high. That's important, because we are now close to an new Dow Theory Buy Signal, which we'll get as soon as the Dow also makes a new high. Here's the Transports index, which is in a perfect rising channel:

The Dow is close to exceeding February's high as well. I don't have a rising channel on Dow, but I do have a strong support turned resistance trendline that's currently targeting the 12800 – 13000 area:

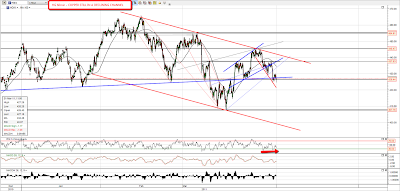
Looking at ES, the rising channel I posted the other day is still holding and the hourly RSI is no longer overbought. Channel support is at 1316 and channel resistance is at 1344. I have the February high just over 1338 and that may provide some resistance:

NQ is leading ES again, which is bullish, though NQ is still over 50 points below the February high and looks most unlikely to make a new high before ES. Nonetheless the declining channel has been broken and strong support has now been established at 2328. A somewhat alarming large triangle or rising wedge has formed on NQ which I'm obviously looking to break up today, and the obvious immediate upside target on a break up would be resistance in the 2363-70 area.

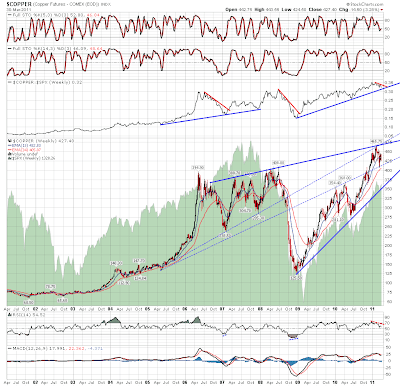
Copper is the fly in my generally bullish soup today, and I posted the longer term chart yesterday to show the potential for a much lower low there. The rally yesterday was feeble and served only to establish the upper trendline of a declining channel. Support is at 425 and if that breaks the next declining channel target is at 418.5. An hourly close above 430.5 will break the declining channel;

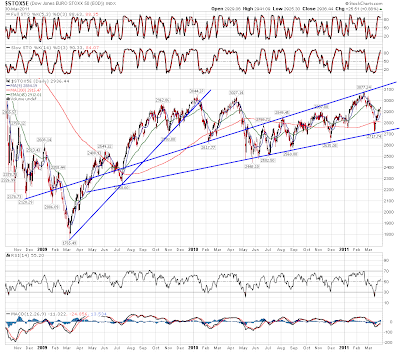
I posted the longer term EURUSD chart yesterday, arguing that there was a high probability topping area in the 1.425 – 1.43 range, supported by the current rising wedge on EUR. I have another forex chart at a similar stage, and that's AUDUSD, where the 20 year chart shows that a long term support turned resistance trendline is about to intersect with the upper trendline of a four year rising wedge on AUD. That double resistance hit should be in the 1.0475 area and is a likely topping area if that too is going to reverse. It isn't all over for the USD bulls yet, and if these long term resistance trendlines on EUR and AUD hold, then we could be looking at a very major low for USD coming up shortly. Here's the AUDUSD chart:

I'm leaning strongly bullish today unless we see a gap down on SPX, which looks unlikely at the time of writing. We also have strong support established slightly below at 1315-6 on ES and 2328 NQ, so if we have an unexpected bull massacre as we had a month ago, then the support levels are clear at least. On ES immediate resistance is at 1325.75, which has had six hits so far (15min candles) since yesterday afternoon. When it breaks ES should be off to the races with an immediate rectangle target at 1330. If there's a large gap up today the stats do not favor a gap fill.


