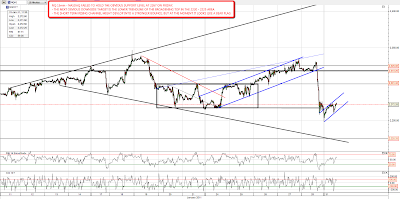
I'm short JAG, and I am increasing the size of that short today. This is a nice topping pattern with plenty of potential downside beneath. Breaking that tinted area is the key next step.
Slope of Hope Blog Posts
Slope initially began as a blog, so this is where most of the website’s content resides. Here we have tens of thousands of posts dating back over a decade. These are listed in reverse chronological order. Click on any category icon below to see posts tagged with that particular subject, or click on a word in the category cloud on the right side of the screen for more specific choices.
Another One-Hit Wonder
I guess we should all know better by now, that Friday was simply the 382nd one-hit wonder dangled in front of the bears. At this point, even a nuclear strike on a major city would cause only a one-day dip.
There are occasions when technical analysis still works, however, so I thought I'd do a post about a recent instance of this. It's a quiet day, so this might be my only post until the close.
This is the kind of trendline break I really like to see; it has three steps:
(a) the red arrow is the initial break of the ascending trendline;
(b) the green arrow marks the point where the price has retraced precisely to the underside of the former support trendline; this is the perfect shorting point;
(c) lastly, for good measure, the blue arrow marks the point where a lower low is made; the trend is changed, and it's down, down, down for the stock
In normal markets, this kind of thing works all the time. I guess HMIN somehow got away with behaving itself As God Intended.
I’m a Balloon Kind of Guy….
Well, as we again face a market which is able to go up, even in the face of international turmoil, we could use a laugh or two. Here is one of my favorite George Carlin (patron saint of Slope) bits of all time. If you've got stuff to do, fine; press Play and listen to it in the background. It is Carlin at his finest. Now gimme a balloon!!!
A Promising Start (by Springheel Jack)
Support finally broke on Friday and there were impressive falls on SPX and Nasdaq while oil spiked up on riots suggesting that the Egyptian dictator Mubarak may be replaced soon.Why's that important for oil? Because Egypt's Suez Canal is a potential choke point for shipping world oil supplies and because the toppling of Mubarak might lead to an aggressive islamist government in this key western ally in the Middle East.
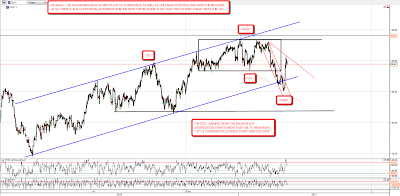
We'll see how that goes but rioting in Egypt looks set to run for a second week this week and Middle Eastern stockmarkets, which are open on Sundays, were down a further 3% to 5% yesterday. Things look promising for more downside on equities in the west too as ES failed to hold the support levels at 1276 and 1273 on Friday and traded as low as 1262.5 overnight. The next target support level that I have on ES is the potential H&S neckline at 1258 and I'm expecting that we'll see that hit this week, though we might well see a bounce first. That matches exactly with the lower trendline of the rising wedge on the SPX daily chart:

NQ failed to hold the key 2267 level on Friday, and is now rising in a short-term channel that looks like a bear flag. If it breaks downward the obvious target is the lower trendline of the broadening top in the 2220-5 area:
Encouragingly for equity shorts, the technical picure on EURUSD now also looks increasingly bearish with a significant break downwards on Friday. For two weeks now EURUSD has been breaking through a succession of three progressiverly shallower trendlines and is now bouncing from a potential H&S neckline. If that plays out the pattern target is at 1.338:

Copper was looking divergently bullish on Friday morning, made my 439 target, reversed to channel support at 433.6, and is now moving up towards declining support in the 444.5 area. I'm expecting that target to be made, and (slightly less confidently) am expecting a reversal there towards the larger channel support in the 425 area. A break above 444.5 would look very bullish and the next short term top will be signalled by the break of the short term channel:

Silver is continuing to look extremely bearish, and reversed at the top of the current declining channel yesterday. I'm expecting a move down within that channel to the key support level and potential H&S neckline at 25. It is possible that silver's H&S has already formed higher with a target at 22, and if 25 fails to hold, that is where I would expect silver to go. A break up through the declining channel would look very bullish and would put the immediate short scenario into serious question:

Oil is the star of the current geopolitical show at the moment of course, and has broken up convincingly from the declining channel that had seemed likely to take it to the potential H&S neckline at 82. Added to that potential H&S pattern we now have a potential (continuation) IHS forming with the neckline at 93.5 and the target in the 102 area. If the crisis in Egypt deepens this week, that will be one to watch:
We may be watching a very significant reversal forming here, and if the SPX rising wedge breaks downwards then I'll be looking for a retracement into the 1200 SPX area, which I'd expect to hold unless Atilla at Xtrends is right about equities having already made a very major top.
