Slope of Hope Blog Posts
Slope initially began as a blog, so this is where most of the website’s content resides. Here we have tens of thousands of posts dating back over a decade. These are listed in reverse chronological order. Click on any category icon below to see posts tagged with that particular subject, or click on a word in the category cloud on the right side of the screen for more specific choices.
Buy Myself a Grey Guitar and Play
In my video a couple of days ago, I specifically called out Jones Apparel as one of my shorts, based on its massive head and shoulders pattern. Well, it looks like the pattern is starting to really kick into gear, as the stock is down double-digits this morning. There is almost nothing supporting the price at this point, and as outlandish as this might sound now, I'm targeting a low single-digit value for this one.
The First Bounce (by Springheel Jack)
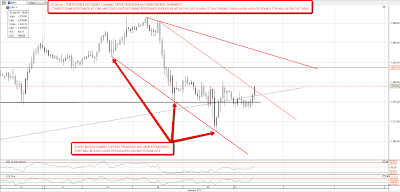
NQ was a lot weaker than ES yesterday, and so rather than NQ hitting the lower trendline of the megaphone at 2266 at the same time ES hit wedge support at 1257, it hit while ES was only at the daily 20 SMA at 1267. They both bounced there and now we will start to see the shape that this correction will take by seeing how far the bounce goes. It's still possible that we could see new highs before the correction really gets going, but there's now been so much technical damage elsewhere that I think that's unlikely. On both NQ and ES we now have fully established declining support trendlines. On NQ that trendline is shallower and I'm expecting it to break on the next big move down as the megaphone, or broadening top to give the proper name, breaks downwards. As for bounce targets that's hard to say, but I have a declining resistance trendline in the 2300 area that I'll be watching carefully:
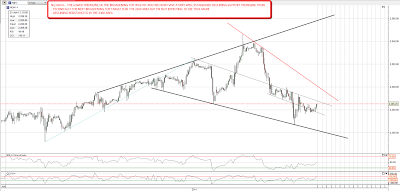
On ES a declining support trendline has been established that will be a buy level on the next big move down. The big rising wedge support trendline was not hit at 1256 yesterday and is unfinished business. Declining resistance for today is in the 1287-8 area. If declining support there is broken then a new high or double-top is still on the table:
Elsewhere on the equity indices the RUT made a nice support break yesterday and has formed another broadening top. Interestingly the target (on IWM) for the broadening top would be the strong support level at 74:

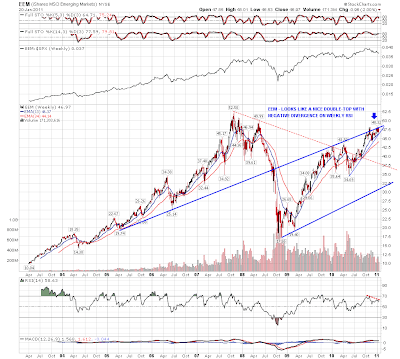
Worldwide there's less damage so far. I always watch EEM as an indicator and there's a very promising looking double top with negative divergence on the weekly chart there. The shorter term support trendline needs to break but when it does it will look like a very attractive short:
EURUSD disregarded my beautiful chart yesterday and went on to make a new high overnight. GBPUSD made a significant support break though and AUDUSD broke a major support trendline, so I'll console myself with the thought that at least EURUSD made that marginal new high with significant negative divergence on the 60min RSI. It should reverse soon I think, but we may see it go higher again while the current equities bounce is ongoing. I've given some thought to the last chart I'll post today, as there are a lot of interesting charts to choose from, but I think I'll have to go with the silver chart, where the H&S neckline and ten week rising channel both broke down yesterday. The target is in the 25 area at a significant support level, and I'm hoping to see a decent bear pattern for the decline so the bottom can be easily identified if it isn't there. I'm a long term silver bull so the low will be a major buying opportunity IMO. It is worth noting however that the 25 level is also a potential neckline for a much larger H&S, and that there is therefore the possibility after a bounce there, of a much larger decline later in the year:

I started off writing this post with the thought that I would combine it with an argument that we have just seen a very major top on commodities, but there were just too many charts to do that. I've therefore written a second post on that subject that I'll publish tonight as a weekend read.
We Get It
Yesterday, one of the regulars here on Slope expressed puzzlement and my frequent mentions of "the evils" out there, such as Bernanke, Geithner, POMO, and so forth. He politely stated that the focus should be on the charts, and that the reason behind the price movement was really neither here nor there. He quickly got a lot of "Likes" on his comment, and I realized he had struck a chord. There was so much chatter about his comment that he wound up deleting it, but I felt it was something I should address.
I've made a habit of writing whatever is on my mind (within reason; I don't want to alienate everyone by being too candid about my feelings) here on Slope. It bugs me……..a lot……..that my beloved free enterprise system has been corrupted on an unprecedented scale, so I've been quite vocal – perhaps to the point of nettlesome – about these persons and actions.
Let us use the metaphor of an airplane pilot. I have been trained, let us suppose, as a pilot. I've got years of experience, volumes of knowledge, and a specific objective (which is to get the plane safely to my destination). I have been able to do this for years. However, one day, some people begin putting Vaseline on my windshield. This ground crew – – Geithner and Blankfein – – smear their POMO sauce all over my windshield so that things are difficult to see.
What used to work doesn't work anymore. Things don't make sense. I can't ascertain what's coming up next. Other pilots, whose windshields are similarly smeared, tell me to just keep flying, and that everything will be fine. Just fly, and don't worry about it. But I can't; it's uncomfortable, unsettling, and bothersome. So I complain about the Vaseline. And I keep complaining.
So it is with the markets today. The easiest thing to do is fly (buy) and keep flying (keep buying). It's worked out for plenty of folks. But it seems insane to me (as examples like FFIV are beginning to show us). I'm not a momentum trader. I don't play "Greater Fool" markets. That costs me sometimes, since insanity like 1999 (and 2009/2010) happen. But pushing my plane full-throttle forward, Vaseline be damned, just isn't the way I'm put together. Maybe that makes me a fool, but at least I'm a fool with integrity.
But I understand the Sloper's point about my all-too-frequent complaints about Vaseline. I'll lighten up about it, since I've made my point. You guys know how I feel. I'll try to refrain from mentioning the Evils anymore – – or at least do so infrequently – – since I understand repeating what I've said doesn't really add anything to the discussion. And that's all I've got to say about that.
Dwindling Loan Loss Reserves (by Runedge)
The major banks have reported this week and have exceeded on the bottom line (top line for the most part was down Q4 2010 versus Q4 2009). The reason for the bottom line beat is they reduced their provision for credit losses. In fact each quarter since at least Q4 2009 they have continually dropped the total allowance for loan losses as a percent of total loans outstanding.
Chris Whalen said it best referring to JPM's earnings "Jamie Dimon is making a bullish bet on housing." What happens if asset prices do not rebound but rather fall? What happens if the foreclosure process extends further with all that is going on in the industry? What happens if mortgage cram downs occur? What happens to second tier liens?
At some point should asset prices fall the banks are not prepared from an earnings standpoint to take the hit to their balance sheet. Rather than lower the provision for credit losses they will need to ramp them back up and take a major hit to bank earnings. Banks are also talking about raising their dividend (good luck finding the cash for that) in the coming year.
The data below supports the theory that their "bullish bet on housing" is the wrong side of the trade. Perhaps there is a strategic reason for them to kick the can down the road right now from a reporting standpoint to build confidence in their equity. In some sense why do the right thing now when there is a chance (albeit slim) that asset prices will rise and total allowances are at adequate levels.
As traders we know prices ALWAYS over correct. Whether it be to the downside or upside, the market never gets it right initially. Looking at this chart below which looks at historic home values the argument can be made that home prices will depreciate possibly as much as 30% more.

The Case-Shiller Price Index below is also showing a double dip in home prices. Many argue that since this index does not measure the entire market that it in fact lags and still it is showing a drop in home prices.

The chart below shows sales activity in 25 major metropolitan areas. There are no "bids" in this market. How can prices rise when supply outweighs demand?

Lastly Lender Processing Services recently reported the following
"Foreclosure inventories also continued to rise for the fifth straight month as delinquent accounts are referred for foreclosure, but the sale of foreclosure properties declined. When compared to January 2008 levels, the foreclosure inventory of jumbo prime loans is nearly seven times higher; the inventory of agency prime loans is nearly six times higher; and the foreclosure inventory of option adjustable-rate mortgage loans is approaching five times the inventory in January 2008."
The banks may argue that falling asset prices does not mean increased balance sheet risk as they hold to maturity or higher delinquency rates. Perhaps that is their bullish bet. There is plenty of data that counters that argument and clearly shows the less financial interest a homeowner has in their asset the far greater chance they will strategically default.
Submitted by Runedge. If you would like to follow my blog please visit - Ultra Trading
