I've been waiting for weeks for the upper trendline of the ES rising wedge to be hit, and it was finally hit near the close yesterday:
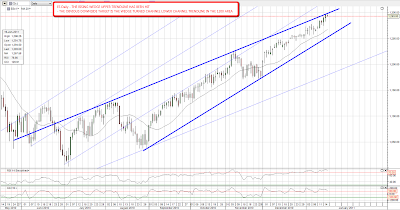
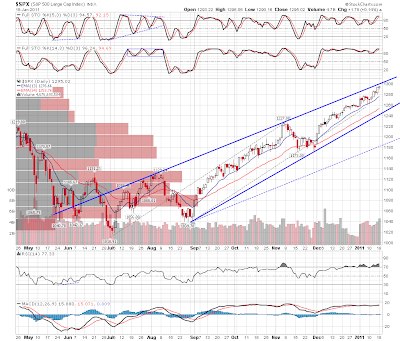
I'm expecting to make the next interim top here or very close to here now, though there's still some wiggle room. As you can see, the rising wedge target on the SPX chart has not quite been hit yet, though it's very close:
My first target for the correction is the 1255 – 1260 area, for the lower trendline of the ES rising wedge. If broken, then my next target is in the 1200 area, depending on when it is reached. That target is based on the assumption that the rising wedge will turn into a rising channel. That's always the first thing I look for if a rising wedge is broken and it happens a lot, though for some reason I've not found any references to this in Bulkowski or other pattern analyses. It really does happen a lot, I was looking at the KO chart yesterday and there was a very nice example there:

There's every reason to think that at least some retracement is due on the Nasdaq chart as well. I've been watching a megaphone build on there, and I considered posting the chart yesterday but it didn't quite make the cut, not least because the 2340 target looked overambitious. It made it though, and the next downside target is in the 2270-5 area:

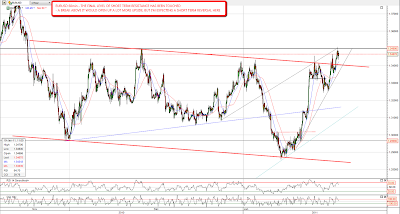
It could go the other way of course. There are still big IHS patterns on copper and EURUSD that look worrying but I'm not expecting either to play out. My analyst friend that called the EURUSD low at 1.29 and I both felt that the first wave up was unlikely to get much beyond 1.35 and we touched that level overnight. If EURUSD breaks 1.35 with confidence though, it might run much further and any equities correction would get tougher:
We might well knock around up here for another couple of days and perhaps have a stab at breaking 1300 on SPX, but this is a very likely area for a short term top, and that's what I'm expecting to see here.
