Slope of Hope Blog Posts
Slope initially began as a blog, so this is where most of the website’s content resides. Here we have tens of thousands of posts dating back over a decade. These are listed in reverse chronological order. Click on any category icon below to see posts tagged with that particular subject, or click on a word in the category cloud on the right side of the screen for more specific choices.
Loan Loss Reserves – A Comparison (by Runedge)
Rather interesting when you compare the Loan Loss Reserves as a % of Total Loans and Leases for C, BAC, JPM, WFC.
For the most part C, BAC, JPM are reserving roughly the same amount (4-5% for BAC and JPM and 6% for C). Wells on the other hand leads us to believe they have far higher quality credits on their balance sheet with reserves in the 3% range. Not sure why that is. For WFC to reserve relative to BAC and JPM they would need to add about 15 billion or in other words, they are more prone to balance sheet risk assuming their credit quality is similar to their competitors.
Based on some recent litigation regarding put back requests, it is arguable that BAC and JPM are under reserved as well and should be reserved more in the range of C. Taking it one step further, does anyone honestly believe any of these reserves are based on the reality of a double dip in housing prices that has been ongoing for about four months now? What about second tier credit quality? What about the risk of mortgage cram downs? What about the risk of increased strategic defaults in the face of the longest duration of unemployment ever?
Balance sheet risk could very well be the theme of 2011 bank earnings.

Submitted by Runedge. If you would like to follow my blog please visit - Ultra Trading
Anyone for Calamari? (by Springheel Jack)
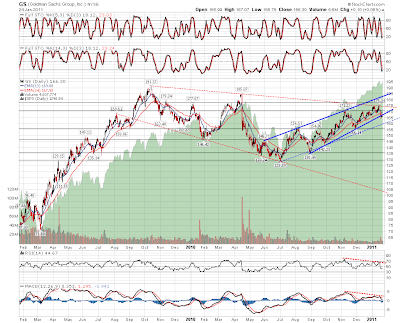
Lots of charts today as it has been very interesting overnight. First though I saw a lovely chart yesterday which I thought I'd share with everyone and it is the daily chart for everyone's favorite vampire squid Goldman Sachs.
It's a beauty, a failure at long term resistance, a broken rising wedge and negative divergence on RSI and MACD. Furthermore there's a broadening descending wedge in red dotted red line that suggests that the next serious downswing may see GS break 100. Strong resistance is slightly below $175 so the risk/reward on the trade looks pretty good, and they may in any case rise with the market over the rest of the week to a better entry level:
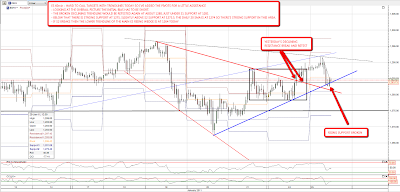
Everyone knew what was going to happen next at the close yesterday at the high, after the breaks of declining resistance on ES and NQ, but the very bullish short term scenario didn't deliver overnight and looks unlikely to deliver today. The rot set in first with copper, which broke the strong recent (wedge) support trendline and then gave up most of the gains in recent days overnight. A break of 422 should take copper to 415 if we see that:

I stayed up late waiting for the NQ rectangle to break up so I could enter long with a target at 2331, but it didn't break up, and after pulling back significantly overnight the next obvious target is the rectangle bottom at 2267. Rectangles are (69%) bullish patterns so that support should hold:

On ES rising support from the low was broken overnight and the next obvious target is the second retest of yesterday's broken declining trendline. If that breaks then there is strong support in the 1273.5-5 area, and below that there is the lower trendline of the main daily rising wedge at 1264:
Oil fell overnight to hit my target at the lower trendline of the five month rising channel. It's showing some signs that it may break through it, in which case I'd expect a move below 85:

What was really interesting overnight though was that EURUSD broke the support trendline from 1.30. This opens the way for a serious retracement which could give the short side a strong edge today. EURUSD has been the despair of the shorts in recent days though and could trade around the broken trendline for a while:

GBPUSD also broke rising support overnight and crashed over 200 pips on the news that the latest GDP figures show that the UK economy contracted 0.5% in the last quarter. I've no idea why this should cause such a fuss as this seems a natural transition from the jobless recovery in the developed world, to the jobless and growthless recovery in the developed world. The UK has moved earlier than most in trying to restrain wild government spending to s(t)imulate growth, and others will follow in due course IMO, but in the meantime GBPUSD is building a bear flag and I'm expecting more weakness:

This might yet turn around, but the immediate picture looks bearish, and I'm expecting to see weakness today. If that develops momentum there is a significant risk of a trend down day.
The Golden Shower
Ever since GDX was in the mid-60s, I have been singing its praises as a short and declaring $48 (or so) as a reasonable target. It continues to perform magnificently and reliably. Thank you, miners!
Daily SPY Recap (by Leaf West)
Hey guys … I'm not sure if any one here on Tim's site wants a recap of the trade set-ups in the SPY for Monday … if not just move along. I just noticed the "hating" going on in the comments for my AAPL Friday trading analysis. I guess Tim's site is the wrong location for educational posts on intra-day trading … therefore this will be my last one.
The SPY action today pretty much stuck to the script that we have been expecting. For those who aren't up to speed, go back and read my blogs comparing the current action to April and read the portion of this week's newsletter that deals with the potential topping patterns (making an ABC as part of the second leg higher).
Here we go …
![]()
