Slope of Hope Blog Posts

Slope initially began as a blog, so this is where most of the website’s content resides. Here we have tens of thousands of posts dating back over a decade. These are listed in reverse chronological order. Click on any category icon below to see posts tagged with that particular subject, or click on a word in the category cloud on the right side of the screen for more specific choices.

Moments of Truth (by Springheel Jack)

By -

I have switched over to the 60min contracts on ES, NQ and TF this morning.

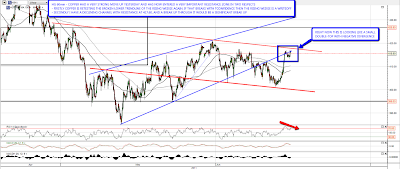
We saw the strong move up I was expecting yesterday morning, and it was strong enough to push the 60min RSIs on ES, NQ & TF into overbought territory. What happens now is very important for setting the direction for the next few days. ES fell slightly short of my 1294/5 target (on June ES), and may nonetheless be forming an IHS with a slightly downsloping neckline. There is another possibility though and that is that ES is still forming a broadening descending wedge with the next downside target in the 1245-50 area, which would take ES the ideal bottoming zone for this latest move down. The key trendline is the upper trendline of the wedge / the IHS neckline. A break above would target 1324 (from the IHS), and a move above 1311.80 on SPX should signal that the major low is in:

There's not much to see on NQ apart from yesterday's broken declining channel, which was retested nicely before the move up during market hours yesterday. There is another possible sloping IHS on NQ but it isn't worth marking up yet. NQ is still underperforming ES considerably which looks bearish:

TF moved almost exactly to the target I gave yesterday morning and there is therefore an IHS with a horizontal neckline that may be forming there. The target would be 816 on a break up, and TF was the strongest of the three indices yesterday and overnight:

I saw a very nice little rising channel on EURUSD yesterday and posted it on twitter in the afternoon. It broke down overnight and EURUSD is now reaching two key support levels. The first support level at 1.343 has already broken since I capped the chart below and EURUSD has reached the second key support level at the H&S neckline at 1.43. There is now therefore a fully formed H&S on EURUSD that indicates to 1.39 on a conviction break of 1.43. That is a very important level to watch today and a break down would also look bearish for equities:

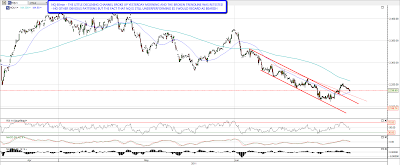
Copper moved up with some conviction yesterday and has now reached a very important resistance zone. Firstly it is again retesting the broken rising wedge lower trendline, and if it breaks up through it with any conviction then that bearish setup is a writeoff. Secondly and less importantly I have a declining channel on HG with resistance at 417.60, and for both of these reasons I would regard an hourly close over that level as an important break up. Short term however the current level looks like a double-top with negative RSI divergence and I'm leaning short on copper today:

Silver is looking very interesting today. In the short term I have a declining channel on silver where the obvious next move is up to channel resistance in the 37.25-37.50 area:

That channel is not the interesting thing about silver at this level, but you can see the really interesting thing on the daily SLV chart, which shows another bounce off the ten month rising support trendline from just under 18. This is a very key trendline and it must really be broken for the deeper summer retracement on gold that I was talking about yesterday. I've also marked in the overhead gap resistance zone that must be broken if silver is to reverse back up strongly:

We haven't reached my SPX & NDX targets for the main interim low that I'm expecting, and I'm still expecting those to be hit.If we're going to reverse back down again then the obvious level to do that from is the highs yesterday. If those highs yesterday are exceeded, on ES and TF particularly, then that would look bullish and as I mentioned earlier, a break above 1311.80 SPX should signal that the low is in. Copper has reached the obvious point of failure here and a break above would look bullish. EURUSD has now fully formed the H&S we've been watching form all week and a neckline break with conviction would look bearish for everything else I've been looking at today. Overall I'm leaning short but expecting a bounce into the open today.

Doldrums

By -

Wow, the market has gone from really exciting to deadly dull within the span of just a couple of days.

Even looking at the after-hours action. there's nothing going on. Nothing's really up; nothing's really down; it's like everything has found its equilibrium all of a sudden.

As for my own positioning – – for the first time in about 300 years, I have more long positions than short positions (33 versus 23), but these longs are intended to be bordering on one-night stands instead of long-term, committed relationships. More precisely, I have definite views as to how much the indexes will recover (they've gone a good chunk of the distance already………….) and I may well be 100% short by early next week.

In the meantime, I am pretty much market neutral, which just about guarantees I'm not going to make or lose much of anything until things are stretched to the upside again (at which time I plan to become SuperBear). I think the Russell might have another 2.5% – tops – of upside, at which time I am going to short everything which isn't nailed down.

So expect things to be relatively mellow on Slope for a little while. That's it from me for today. Good night.

Hedging Update – Stocks

By -

In order to cover more stocks and ETFs this week, I thought I'd break up the hedging update into two posts — one primarily for stocks, and one for ETFs. The table below shows the costs, as of Tuesday's close, of hedging 10 widely-traded NYSE stocks and 9 of the 10 most widely-traded Nasdaq names against greater-than-20% declines over the next several months, using optimal puts.

Comparisons

For comparison purposes, I've also added the costs of hedging the SPDR S&P 500 Trust ETF (SPY) and the SPDR Dow Jones Industrial Average ETF (DIA) against the similar declines. The Nasdaq 100-tracking ETF PowerShares QQQ Trust ETF (QQQ) is also included, as it was on Nasdaq's most active list as of Tuesday. First, a reminder about what optimal puts mean in this context, and why I've used 20% as a decline threshold, plus a note on why there were no optimal puts available for one of the Nasdaq stocks.

Optimal Puts

Optimal puts are the ones that will give you the level of protection you want at the lowest possible cost. As University of Maine finance professor Dr. Robert Strong, CFA has noted, picking the most economical puts can be a complicated task. With Portfolio Armor (available on the web, and as an Apple iOS app), you just enter the symbol of the stock or ETF you're looking to hedge, the number of shares you own, and the maximum decline you're willing to risk (your threshold). Then the app uses an algorithm developed by a finance Ph.D to sort through and analyze all of the available puts for your position, scanning for the optimal ones.

Decline Thresholds

You can enter any percentage you like for a threshold when using Portfolio Armor (the higher the percentage though, the greater the chance you will find optimal puts for your position). The idea for a 20% threshold comes, as I've mentioned before, from a comment fund manager John Hussman made in a market commentary in October 2008:

An intolerable loss, in my view, is one that requires a heroic recovery simply to break even … a short-term loss of 20%, particularly after the market has become severely depressed, should not be at all intolerable to long-term investors because such losses are generally reversed in the first few months of an advance (or even a powerful bear market rally). 

Essentially, 20% is a large enough threshold that it reduces the cost of hedging but not so large that it precludes a recovery. When hedging, cost is always a concern, which is where optimal puts come in.

How Costs Are Calculated

To be conservative, Portfolio Armor calculated the costs below based on the ask prices of the optimal put options. In practice, though, an investor may be able to buy some of these put options for less (i.e., at a price between the bid and the ask).

Why There Were No Optimal Puts for LVLT

In some cases, the cost of protection may be greater than the loss you are looking to hedge against. That was the case with Level 3 Communications (LVLT). As of Tuesday, the cost of protecting against greater-than-20% declines in that stock over the next several months was itself greater than 20%. Because of that, Portfolio Armor indicated that no optimal contracts were found for it.

Hedging Costs as of Tuesday's Close

Symbol

Name

Cost of Protection (as % of position value)

  Nasdaq Stocks  
(CSCO) Cisco Systems 5.84%**
(LVLT) Level 3 Communications No optimal puts at this threshold
(MSFT) Microsoft 2.35%**
(INTC) Intel Corporation 3.71%**
(MU) Micron Technologies Inc. 19.3%**
(QQQ) PowerShares QQQ Trust ETF 1.64%*
(ORCL) Oracle 3.02%*
(DELL) Dell, Inc. 4.72%**
(CMCSA) Comcast Corporation 3.34%**
(YHOO) Yahoo! Inc. 7.24%**
(FITB) Fifth Third Bancorp 5.93%**
  NYSE Stocks  
(BAC) Bank of America Corporation 6.94%**
(F) Ford Motor Co. 4.69%*
(S) Sprint Nextel Corp. 9.76%**
(C) Citigroup, Inc. 3.33%*
(PFE) Pfizer, Inc. 1.90%*
(GE) General Electric Co. (GE) 3.01%*
(WFC) Wells Fargo & Company 5.48%**
(NOK) Nokia Corporation 10.70%*
(RF) Regions Financial 12.46%**
(JPM) JPMorgan Chase & Co. 2.69%*

(SPY)

SPDR S&P 500

1.28%*

(DIA) SPDR Dow Jones Industrial Avg. 1.09%*

*Based on optimal puts expiring in December, 2011.

**Based on optimal puts expiring in January, 2012.

Monsanto on the Move (by Mike Paulenoff)

By -

Agricultural product manufacturers of fertilizer and chemicals would appear to be a reasonable place to allocate some funds through the summer months in an otherwise unfriendly environment for the equity market — provided the technical work supports such a commitment.

My near- and medium-term work both argue that Monsanto (MON) ended a major bear phase in July 2010 at 44.61 and since has carved out a constructive and very promising pattern that should continue higher towards a confrontation with key two-year resistance at 73.80 next.

WjQ6s2NuJ
Originally published on MPTrader.com.