Slope of Hope Blog Posts
Slope initially began as a blog, so this is where most of the website’s content resides. Here we have tens of thousands of posts dating back over a decade. These are listed in reverse chronological order. Click on any category icon below to see posts tagged with that particular subject, or click on a word in the category cloud on the right side of the screen for more specific choices.
Wild Card Fed Day (by Springheel Jack)
Some are born great, some achieve greatness, and some have greatness thrust upon them.
I'm a Shakespeare buff so you'll to put up with the odd quote. This one is from Malvolio in Twelfth Night and the relevance today is that the same sort of gradation could be applied to trendlines, which might then go:
Some trendlines are clear early, some become clear later, and some arrive so late that you've stopped looking for them
In this case the low yesterday on SPY and SPX was at rising support from the December 19th low. I've been complaining for weeks that the there was no decent support trendline from there, and I wasn't even looking for it yesterday. Nonetheless, it is now established and it is now therefore also clear that we are looking at a rising wedge from that Dec 19th low. We might yet see a new high within that rising wedge, but it should be marginal. Wedge resistance is under 1330 SPX and I'd be extremely surprised to see the wedge break up with confidence here. Here's the updated setup on the SPX 30min chart with the wave count:
All it Takes is One Bad Trade
I came across a great article on the one bad trade syndrome. Several months ago, Slopers were privy to a real-life blow-up in which a trader essentially risked all of his trading capital on essentially one trade(disregarded the importance of position-sizing). I want to make sure that I never make the same mistake. Currently, my positions are teetering on max pain (stop-loss). My outlook remains with the pullback scenario that I have mentioned repeatedly the past few weeks – short-term bearish.
Check out the article - All it Takes is One Bad Trade
Don’t Be a Hero When Trading Options
Options trading seems to create a “get rick quick mentality” that attracts the “speculative gamblers” out there. To me this approach seems short-sighted, unless that is your goal and you are willing to take the risk. I prefer to take the “long-term” approach that attempts to beat the market over an extended period of time. Admittingly, I “go for the gold” sometimes and place a highly speculative trade. But those are few and far between and I would never allocate a large portion of my portfolio to a trade like this. It is just too risky for my blood after what I have experienced as a trader. Take the loss and move on. Think in terms of probablities. Use a scientific approach. Losses are a cost of doing business. It is how your account compares to the benchmarks after a long-period of time that defines your success. Any Joe options trader can make a bundle on a trade. It is how Joe performs over the long-term that defines his success.

If you haven’t already, don’t forget to sign-up for my :
Also, for those of you who live on Facebook. You can access my info there as well. Just click on LIKE.
Market Manipulation 101 (by BBFinance)
ES closes the last four days as follows:
1310.50, 1310.75, 1311 and today 1310.50
Does anybody still think that there is no market manipulation? As usual, volume was almost non-existent and well below average.
Given that we are being set up nicely, where the retail is encouraged to buy buy buy by various talking heads of CNBC and other MSM, this itself should raise the red flag that there is cliff ahead.
Everything is screaming for a reversal but the money flowing in from Europe is keeping the US stock markets alive. Some of the reversal patterns are so rare that they happen once in a while and yet we are hanging on. Can the market defy gravity forever? Unless there is more free money infused by the Feb, it cannot. So may be one more day we will have to bear the agony. In the mean time, gold down, silver down, oil down, copper down and equities barely moved!
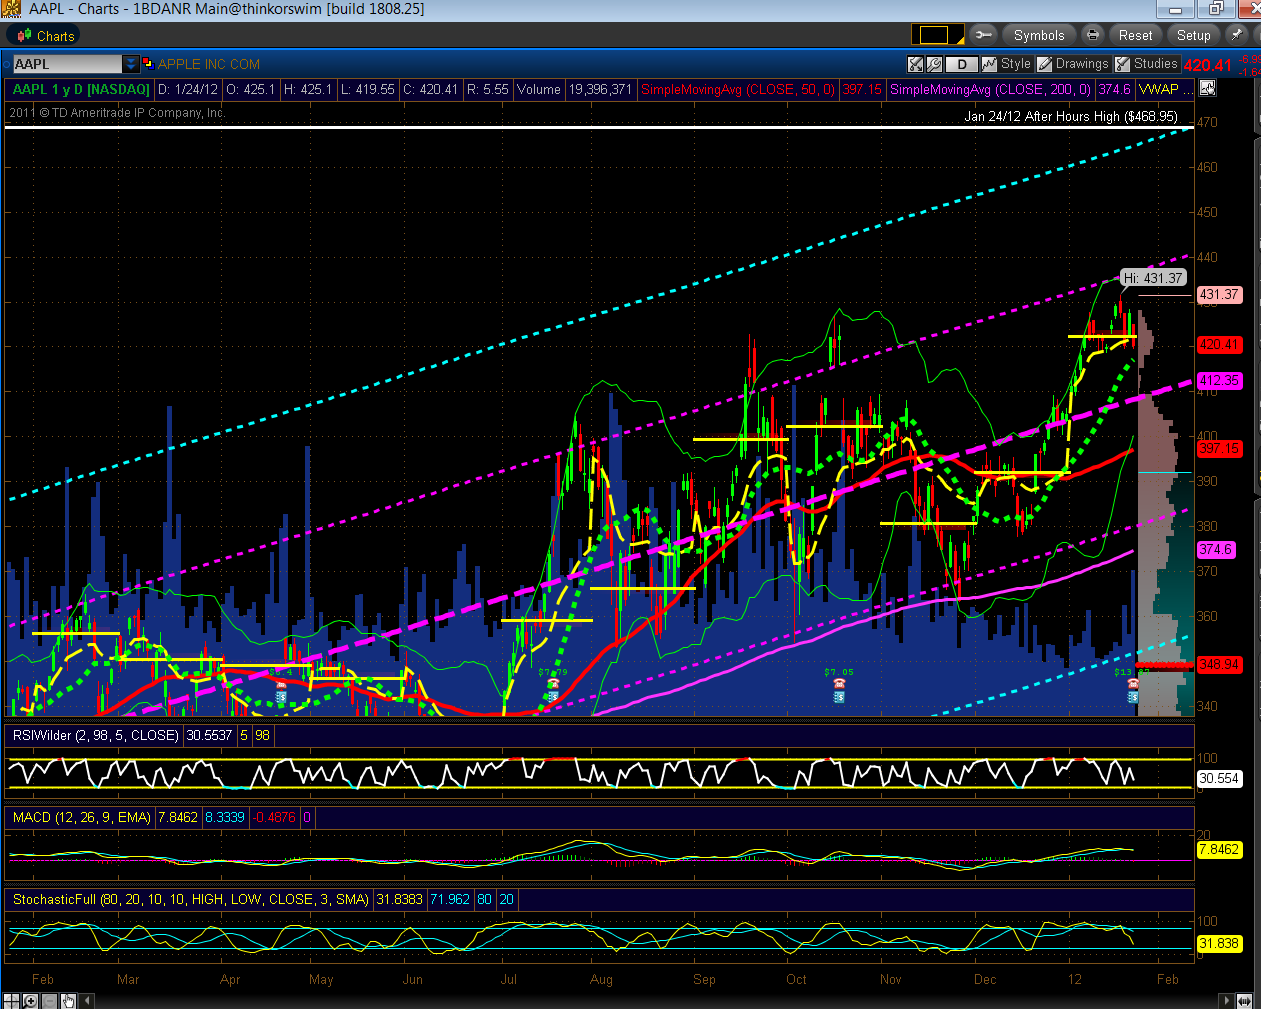
After-Hours Earnings Breakout in AAPL
As I'm writing this post, AAPL has broken out to make an all-time high of 468.95 in after-hours trading after releasing their latest earnings report. I last wrote about AAPL on January 9th and mentioned a couple of possible scenarios. One was a pullback to re-test November lows, and the other was a run-up by market makers into earnings.
The Daily chart below shows where tonight's price was hit…above the +2 deviation level of the upward-trending regression channel which began at the June 2010 lows. When tomorrow's candle opens, it may re-test tonight's high before dropping. Near-term support would sit, firstly, at the +1 deviation level around 440, followed by this month's Volume Profile POC (yellow horizontal line) at 422.32…the next level would lie at the channel "mean" (currently at 412.35), and, subsequently, at the 50 sma (red) at 397.15.
As I mentioned in my previous post, AAPL has, so far, been unable to remain above its +1 deviation level of this channel…we'll see whether the same applies over the next days/weeks ahead, or whether it's "different this time"…with 500.00 within reach, who knows!