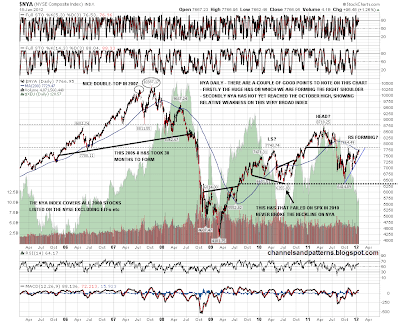
I'm going to be posting a lot of bullish charts today, so I'll balance that by leading with a bearish big picture chart. That chart is of the NYA Composite, which is a very broad based index including all stocks listed on NYSE, with the exception of some ETFs etc. On this chart you can see the huge H&S building that I have posted before, and it's also worth noting that NYA has not yet reached the October high, which is very strong resistance as it was also the H&S neckline for the topping H&S last year. A lot of analysts are changing to a bias that a new bull market is in progress but I'm not one of them yet, though I am most definitely weighing the evidence that it might be:
Slope of Hope Blog Posts
Slope initially began as a blog, so this is where most of the website’s content resides. Here we have tens of thousands of posts dating back over a decade. These are listed in reverse chronological order. Click on any category icon below to see posts tagged with that particular subject, or click on a word in the category cloud on the right side of the screen for more specific choices.
Up, Up and Away? Not If History Has a Say.
The market rallied hard making it the 9 out of 11 tradings days with positive gains. SPY has made since 4.2% during that time, but over the past month SPY has made a staggering 8.7%. And as expected, now we are seeing sentiment change.
But, I am not completely sold on the rally yet.
Why? Well, other than the overbought to very overbought readings in most of the ETFs I follow and all of the reasons mentioned in my post yesterday, we are also entering into the weakest period of the month of January. Just look at the DIA chart below for percentage of times positive over the next five trading days.
courtesy of Sentimentrader.com (click to enlarge)
YM, ES, NQ & TF Market Hours Only Charts
Below are 90-day 60-minute market hours only charts of YM, ES, NQ & TF. Overlayed on each chart are Bollinger Bands (which are based on the 50 sma and deviations of +2.0 and -2.0), monthly Volume Profiles (red horizontal lines are POC), 200 sma (pink), Volume Profile for the 90 days at the right edge of the chart, and my short-term RSI indicator. I've chosen this timeframe to look at price action from the October 2011 lows during market hours only.
Price is pushing the boundaries of the upper Bollinger Band, and my RSI is showing a negative divergence from yesterday's and today's actions…ones to watch to see whether they return to the mid-Bollinger Band (50 sma) soon. Alternatively, in view of breaks and closes above near-term resistance levels that occurred today on the Major Indices (except Dow Utilities), as mentioned in my post of January 10th, we may see a parabolic rise culminating in exhaustion volumes before such a drop takes place.
Just to Lighten Things Up
One of the great MST3K shorts of all time………..well worth a piece of your evening:
Unmitigated Victory for the Bulls
In spite of all the reasons – – analogs, statistics, stochastics – – that were emailed to me about why the market would absolutely, positively, no-doubt-about-it fall this week………it isn't happening. Indeed, the bulls have pretty much owned every single one of the eleven trading days so far this year.
The bearish case is getting weaker by the day, and the bulls were able to create breakouts across the board today…..
+ without any announcement from the Fed
+ without any big news from Europe
+ without any "stimulus" goose of any kind.
Just plain, old-fashioned, earnings-driven buying.


