
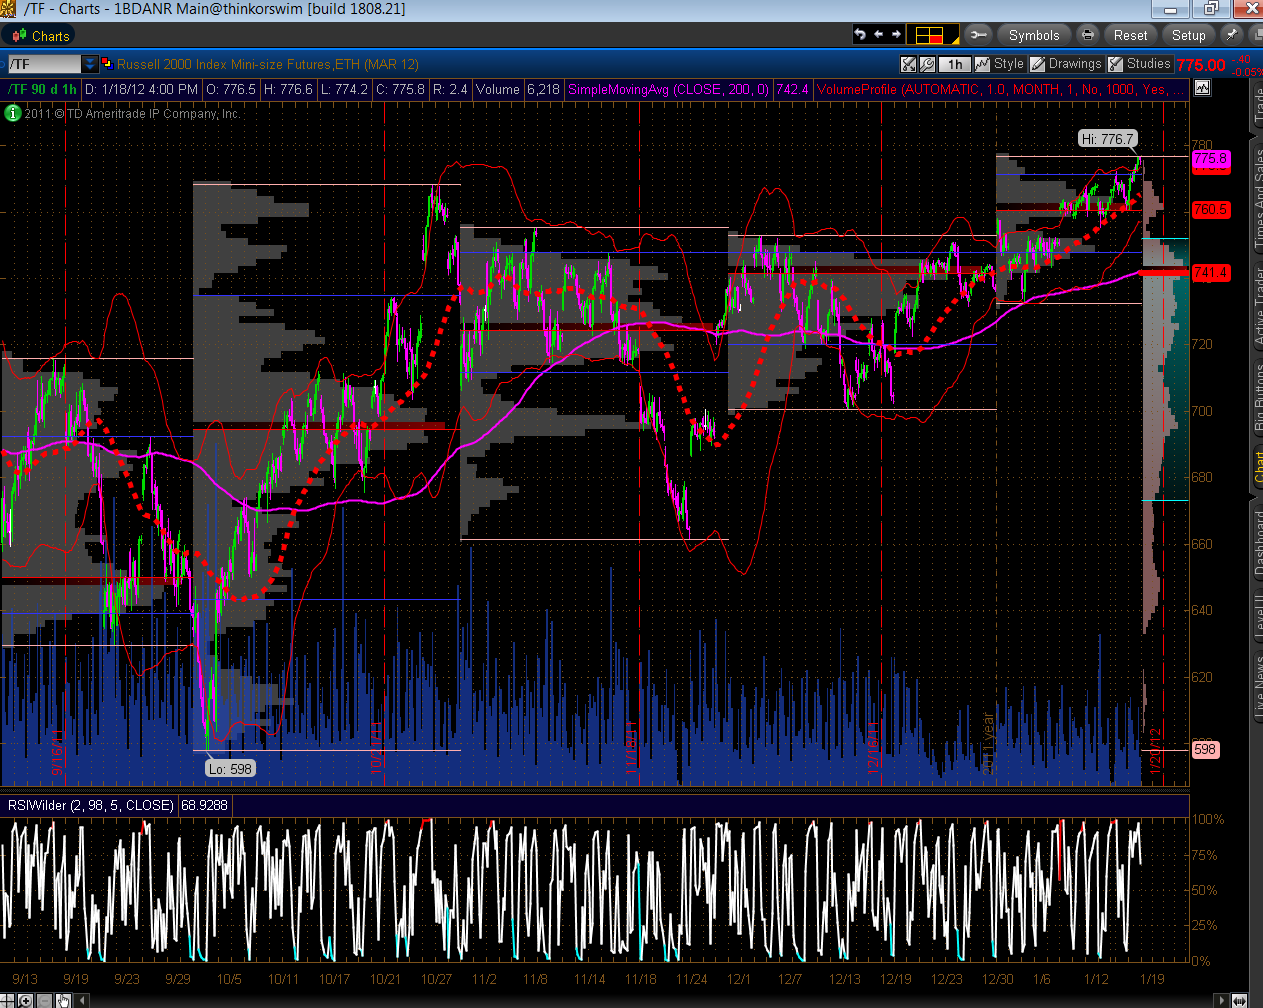
Below are 90-day 60-minute market hours only charts of YM, ES, NQ & TF. Overlayed on each chart are Bollinger Bands (which are based on the 50 sma and deviations of +2.0 and -2.0), monthly Volume Profiles (red horizontal lines are POC), 200 sma (pink), Volume Profile for the 90 days at the right edge of the chart, and my short-term RSI indicator. I've chosen this timeframe to look at price action from the October 2011 lows during market hours only.
Price is pushing the boundaries of the upper Bollinger Band, and my RSI is showing a negative divergence from yesterday's and today's actions…ones to watch to see whether they return to the mid-Bollinger Band (50 sma) soon. Alternatively, in view of breaks and closes above near-term resistance levels that occurred today on the Major Indices (except Dow Utilities), as mentioned in my post of January 10th, we may see a parabolic rise culminating in exhaustion volumes before such a drop takes place.


http://strawberryblondesmarketsummary.blogspot.com/
