
I was saying yesterday morning that there would most likely be a bounce before any test of the 1325 SPX support level, and we saw that yesterday afternoon. So far that bounce looks like a bear flag, and if we see more upside today I have a target in the strong resistance area 1357-63, with the gap fill from yesterday morning at 1362.66 SPX of course. The middle bollinger band held on a closing basis, and if we see a close below 1350, and a break of rising support from the June low on the daily chart then the next obvious support and target are the lower bollinger band and the 200 DMA in the 1315 area:

On the 60min chart the support trendline from the June low vanishes. I've sketched in three possible contenders but there's nothing usable. The key support levels to watch are the 1335 area (IHS neckline), and 1325.41, the last low and possible double top neckline / valley low:

I was looking at the DAX daily chart this morning and it's worth noting there that the bounce from the lows a few weeks ago looks like a retest of broken support from October and a failed attempt to recover the important 100 DMA. This looks like a bear flag but that flag has not yet broken down of course:

A reader yesterday suggested that my huge H&S on EURUSD was a bit of a stretch and well, beauty is in the eye of the beholder I guess. H&S patterns are often unpleasing to the eye however and this is a good time to review the last ugly H&S on EURUSD which broke down late last year. Again it isn't particularly pretty, but it has behaved perfectly as an H&S so far and it's worth mentioning at this stage because the target I gave at the time was the 1.12 area. That target is still very much in play though obviously the larger pattern is suggesting a move much lower. You often see a smaller H&S pattern at the top of the right shoulder of a larger pattern so these should be considered in combination:

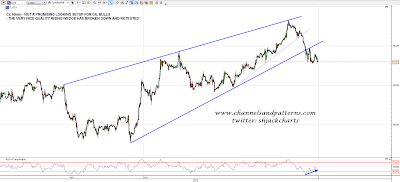
The rising wedge I posted on CL yesterday has broken down and retested. This is a very bearish looking setup and I'm expecting more downside:
I'll finish with gold today, where there is a very nice symmetrical triangle from the May low with the next obvious target in the 1610-5 area. As and when this breaks it should deliver a decent move, though it's worth noting that triangles have a nasty habit of breaking one way before resolving in the other. The possible double-bottom indicating to new highs is worth bearing in mind:

I have mixed feelings about direction today and it could go either way, with perhaps a slight bias towards more upside to try to fill yesterday's gap. After this bounce is finished I'm leaning towards a test of 1325 SPX and if that breaks I think we may well see the June lows tested. A close over 1363 SPX would make this less likely.
