
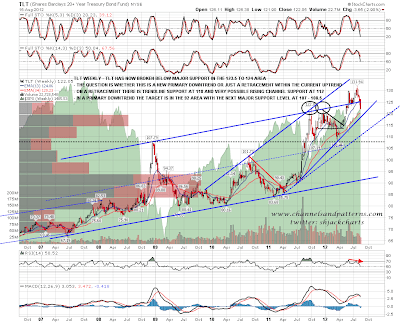
Somewhat to my surprise TLT gapped down through major support at 123.5 to 124 yesterday, and almost made it to the sloping H&S target in the 121 area. Realistically I am expecting more downside on TLT after this break, though we might first see broken support retested and possibly yesterday morning's gap filled first. There is an OK looking double-top indicating to the 116.5 to 117 area, but the quality isn't great and I'd prefer to consider the trendline setup as I think it is more likely to deliver the correct target.
First trendline support is decent and is in the 118 to 118.5 area. This is my minimum target unless we see a strong and fast recovery over broken support, with it held afterwards. On a break below 118 to 118.5 I have possible rising channel support in the 110 – 112 area. On a break below that support trendline TLT should be in a primary downtrend, with the obvious target in the 92 area. However the next major support level is in the 107 to 108.5 area and that is particularly important as that support level is a possible H&S neckline for an H&S that would target the 84 area, subject to exactly how that formed. Any further downside on TLT will tend to support equities while it lasts, though the correlation isn't tight:
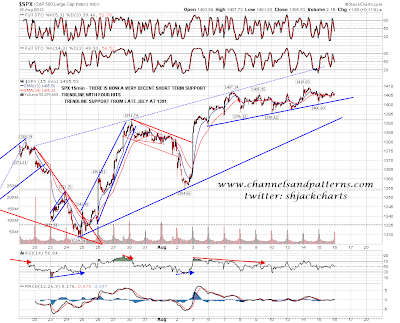
Short term on the SPX 15min chart a decent four touch support trendline has formed, though on a break below the obvious next target is only in the 1391/2 area at rising support from the late July low. That support trendline will be at 1400 by the end of the week:
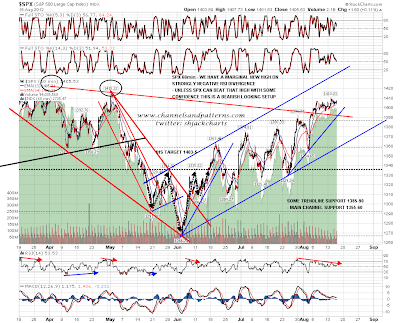
On the bigger picture 60min chart that support at 1391/2 is reinforced by broken declining resistance from the April high being there too. Obviously SPX is in a rising channel with channel support (and the 100 DMA) in the 1360 area, and while there are decent reasons to think we might see a swing high soon, there won't be anything to get really excited about on the bear side until that rising channel breaks down:
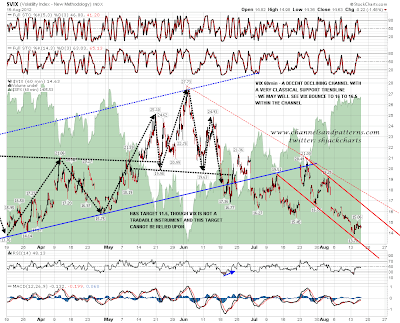
I've been looking at Vix this morning and I have a decent short term declining channel there, with a particularly nice support trendline. We may well see a move here on Vix to test channel resistance in the 16 to 16.5 area. It's worth noting from this chart that the H&S target from May/June is in the 11.5 area, though Vix is not a tradeable instrument and that can't really be relied upon. Just sayin' though:
EURUSD hit my target trendline overnight and has reversed there so far. A nice looking W bottom is forming there on positive RSI divergence and with a target in the 1.2355 area on a break over 1.2305. The next trendline target is in the 1.253 area, but the reversal at the support trendline wasn't perfect, and the pinocchio through it is a warning signal that the wedge may well break down before any new rally highs are made.

On oil yesterday's triangle has broken up and CL has made a marginal new high just under resistance at 95. Marginal new highs tend to be bearish but the overnight action looks like a bull flag and there's every reason to think that CL will make a more confident high soon. As with SPX, CL is in a rising channel, and as long as that lasts there is reason to lean bullish on oil overall:

As I was saying yesterday, as long as TLT held major support at 123.5 to 124, there was good reason to think that we were very close to a swing high on equities that might be followed by a strong downtrend. Obviously TLT has broken that support, and that opens up more downside on TLT, and upside on equities. EURUSD has reversed back up this morning and I'm not seeing much that suggests that the bears might have a good day today. There is strong support on SPX in the 1391/22 area and the bear side will start to look interesting if that breaks. Short term any touch of that short term support trendline on the SPX 15min will look like a buy opportunity, and any break below will look like a short term sell for a possible test of 1391/2 support.
