Slope of Hope Blog Posts
Slope initially began as a blog, so this is where most of the website’s content resides. Here we have tens of thousands of posts dating back over a decade. These are listed in reverse chronological order. Click on any category icon below to see posts tagged with that particular subject, or click on a word in the category cloud on the right side of the screen for more specific choices.
NASDAQ Retracement Closing In
The all-too-obvious head and shoulders on the NQ led me to speculate we'd get a drop (which we got last week) followed by a rise (which we're getting right now). I'm going to allow a little wiggle room, tinted below, with respect to just how high the retracement will carry, but I think this is going to run out of gas soon.
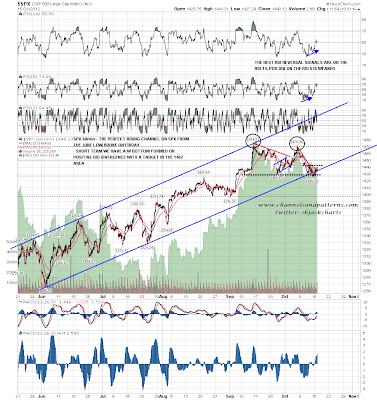
Bullish with Reservations (by Springheel Jack)
I mentioned the possible positive divergence on the SPX 60min RSI yesterday morning saying that it might deliver a strong bounce and well here we are. I have a W bottom target in the 1462 area on an open over 1444, but realistically this looks like a setup to retest the highs:
Comparison of S&P 500, Russell 2000, Gold, and Oil (by SB)
I thought I'd look at the S&P 500 and Russell 2000 Indices, Gold,
and Oil to compare where they are trading on a 1-Year Daily timeframe
relative to their 50 sma and on a 3-Year, 1-Year Daily, and 11-Day timeframe
relative to each other.
The first chartgrid shows a 1-Year
timeframe, with the SPX and RUT trading around their 50 sma, Gold is
above its 50 sma, and Oil is below its 50 sma. The second chartgrid shows a
2-Month close-up shot, with today's recovery into the close on
the SPX, RUT, and Oil. Gold closed near today's low. While the SPX and RUT have
made a new high during the past year (which is serving as near-term resistance,
thus far), Gold and Oil have not. The triple top on Gold at 1800 is serving as
major price resistance, while the 100.00 level is holding as major price
resistance on Oil (with the 50 sma holding as near-term resistance at
93.96).
Famous Double Tops for $1,200 (by phantomcapital)
Before the bulls’ heads explode from the massive one day 11.54
point rally in the S&P let me come to the rescue and pour some ice cold
water on the euphoria. I’m going to keep
the prose to a minimum and just offer a series of charts. The first three are the last three major
double tops IN WHICH the right peak just fell short of the left (this is hugely
important psychologically). The last is
just a little bear porn that might just morph from fantasy to reality.
July – August 2011
