
SPX rode the daily lower bollinger band down for a second day yesterday. This can last a while but while it does moves downwards are likely to be incremental rather than strong pushes down. The obvious next target in the 1397 SPX area has not yet been reached:
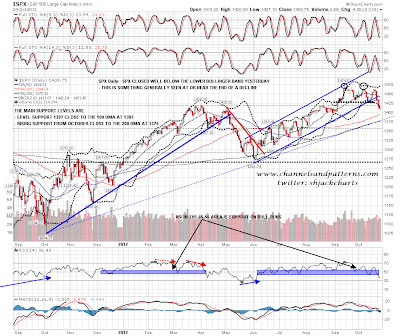
You can see that target more clearly on the SPX 60min chart and how the 1397 SPX level is very much a possible H&S neckline:

Today however I'm going to talk mainly about bullish reversal setups, as there are decent ones on both ES and NQ. I'll do ES first as it follows on from the SPX charts and there declining channel resistance broke overnight and a very nice W bottom has formed. The W bottom target is in the 1428 area on a conviction break over 1415. I have added a currently wildly speculative possible upper channel trendline as there is a clear defined support trendline. If ES is forming a wedge however that trendline target could be anywhere below that possible channel target:

On NQ I posted a strong W bottom setup yesterday morning, but I don't think I'd call this a W bottom setup today. What there is however is a declining channel, with the current lows testing the serious support I mentioned on Tuesday and Wednesday, and a channel resistance trendline target in the 2730 area (and declining). There is strong positive RSI divergence and the odds of a bounce here are good:

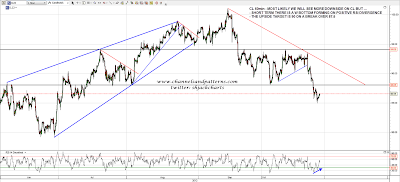
I'm expecting more downside on CL but short term there is a possible W bottom on positive 60min RSI divergence there as well. The target would be the 90 area on a conviction break over the 87.5 area:
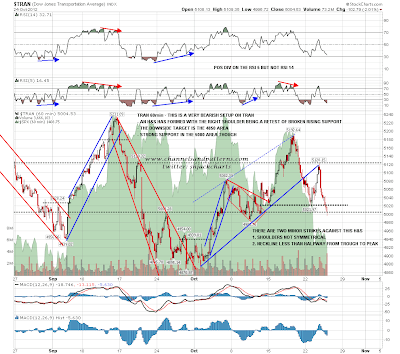
As I mentioned yesterday, reversal setups often get steamrollered in strong trends and while the odds of a decent bounce here look good, there is some reason for caution. My friend @chewtonic mentioned an H&S on TRAN to me last night and there is one there that has formed and broken down. it's not an ideal pattern for symmetry, and I prefer patterns where the neckline is over halfway from the previous low to the high, but it's well worth noting, and would start to look serious if TRAN breaks below support just over 5000:
The last chart today is a longer term look at DX (USD futures). I'm showing the main trends over the last few years on this chart and it's obviously clear that the trend up from 2011 has ended. Furthermore an H&S is forming at the 78.6 neckline that would have a target slightly above the 2011 lows on a break downwards. However the current decline trendline was too steep and has broken up, and I think we may well see a strong bounce to establish the main decline trendline for the current move. If so then there is a possible W bottom targeting 82.1 on a break over 80.35. Worth bearing in mind:

There are very nice bounce setups on ES and NQ particularly and I'm leaning towards seeing those play out. If we see that break over 1415 the W bottom target on ES is 1428, and there is strong resistance not far above there at 1432 that is also a possible IHS neckline. If 1415 holds then the next downside target on ES is 1388-93, based on strong support on ES, the SPX 50 DMA, and the strong support level on SPX at 1397.
