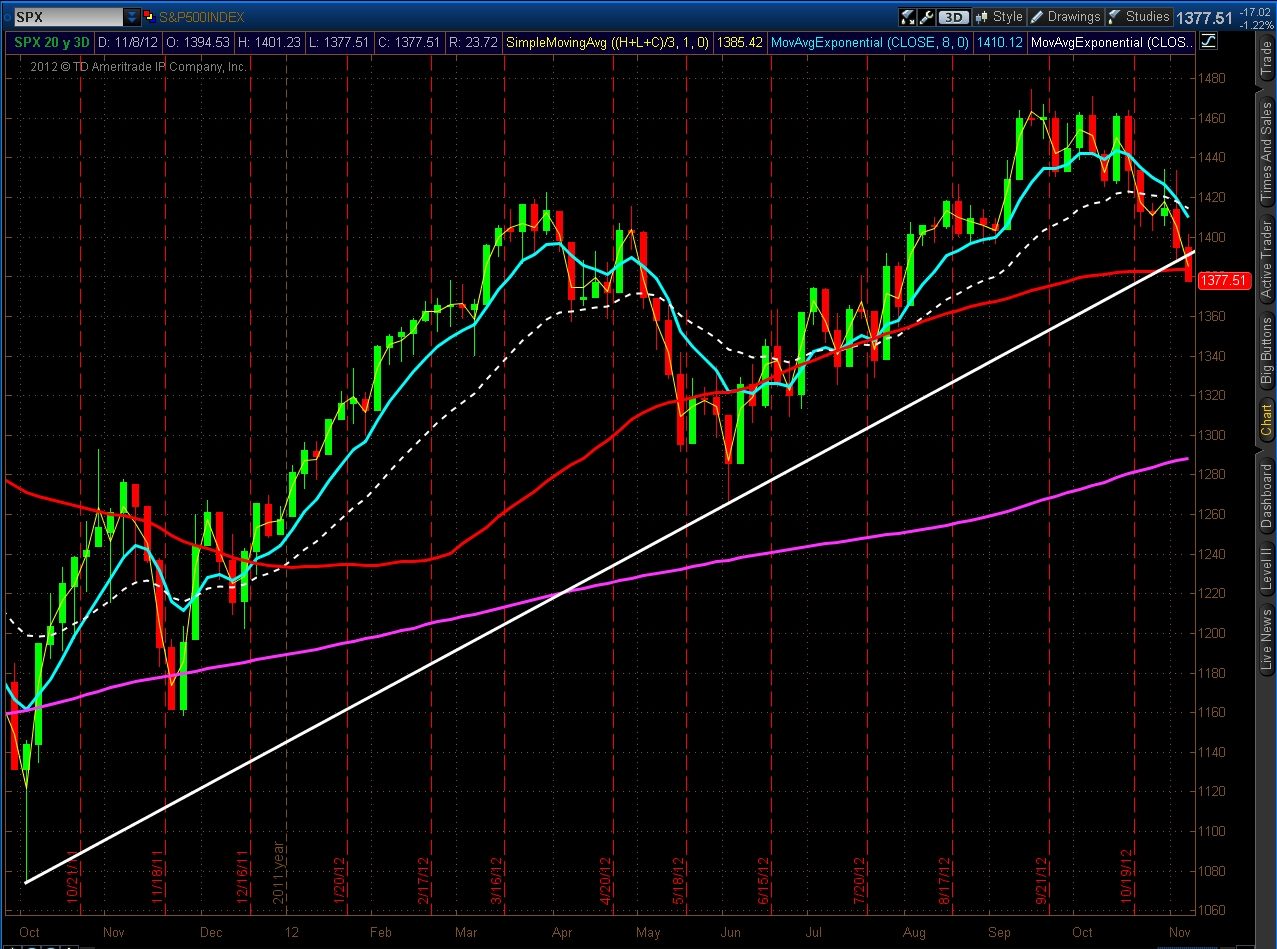
Following on the heels of yesterday's bearish trendline breaks on 6 of the 7 Major
Indices, the SPX broke and closed below its uptrend line from the October
2011 lows in today's (Thursday's) price action, as shown on the chart below.
Note that each candle represents three (3) days on this chart.
All seven Major Indices have now broken and closed below this major
uptrend line in what could be a setup for a major move down. Any backtest of and
subsequent failure to break and hold above the respective trendlines would
confirm such a scenario. Of course, we may see continued (and even accelerated)
weakness from here, which could send the related E-mini Futures Indices (YM, ES
& TF) to their respective Head & Shoulders targets of 12400, 1330, and 735, inasmuch
as their necklines have now been broken.