
Further to my last weekly market update, this week's update will look
at:
- + 6 Major Indices
- + 9 Major Sectors
- + A comparison of the SPX to other World Indices
6 Major Indices
Continuing with last week's weakness, all six Major
Indices closed this week lower, as shown on the Weekly charts and the
1-Week percentage gained/lost graph below.


9 Major Sectors
Also continuing with last week's weakness, all nine
Major Sectors closed this past week lower, as shown on the Weekly charts
and the 1-Week percentage gained/lost graph below.


In
general, this week's losses (after the initial "dead-cat bounce" at the
beginning of the week) may be attributed to the markets' reaction to the U.S.
election results. All of the Major Indices and 8 of the 9 Major Sectors closed
below their mid-Bollinger Band…the exception is the Financial Sector, which
ended just above. Once again, I would suggest monitoring price action on these
around their mid-Bollinger Band in order to gauge relative strength (above) or
weakness (below).
As I mentioned in my posts of November 8th and November 7th, each of the Major Indices (including a 7th…the
S&P 100 Index) have now broken below their major uptrend line from the
October 2011 lows. Any backtest of and subsequent failure to break and hold
above their respective trendlines would confirm a setup for a major move down.
We could, of course, see continued weakness from here, which could send the
related E-mini Futures Indices (YM, ES & TF) to their respective Head & Shoulders targets of 12400, 1330, and 735, inasmuch
as their necklines have now been broken.
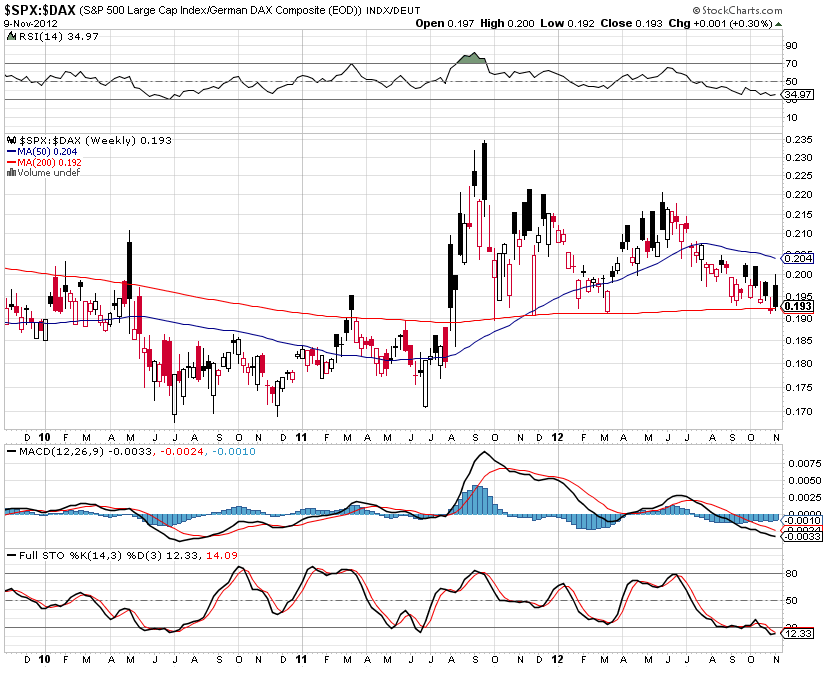
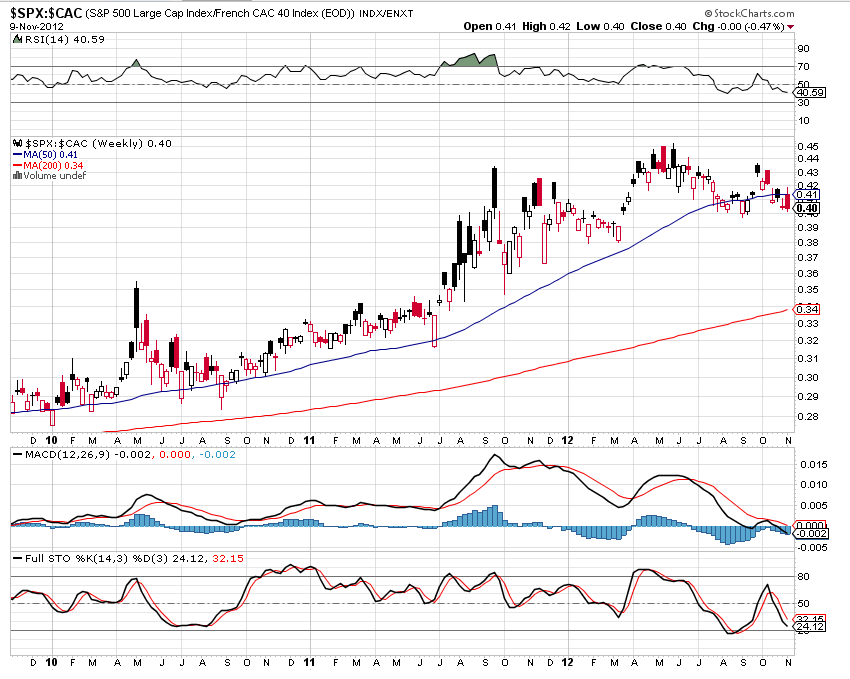
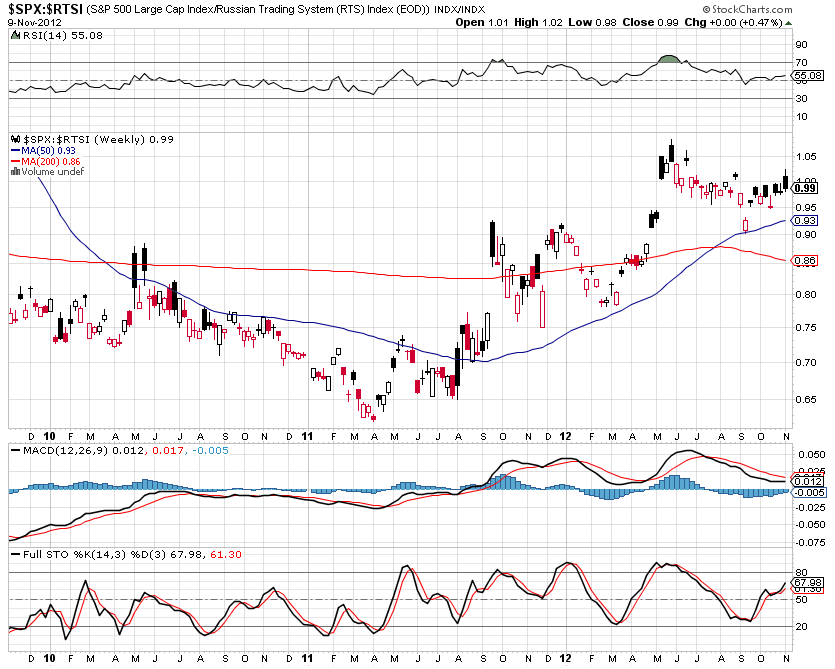
SPX vs. Other World Indices
Depicted on the following Weekly
ratio charts are comparisons of the S&P 500 Index with other World
Indices. As I mentioned in my post of October 26th, the SPX has weakened compared to all
of them, either in the past few days, couple of weeks, couple of months, or from
mid-2012.
You can see that this week's early rally didn't last, and the
SPX finished either close to last week's close or below. Most of the indicators
are still trending down, which suggest further relative weakness to come for the
SPX compared with other World Indices.
The big question
is whether the SPX resumes a leadership role compared to these other indices in
the next few days, weeks, or even months. We may see further comparative
weakness until the the Fiscal Cliff issue and looming Debt Ceiling issue are resolved. Until they are, the markets
will remain volatile and reactive to news-related events, inasmuch as there is a
great deal of domestic and foreign economic uncertainty related to these issues.
Either way, it will be interesting to see where the SPX ends up by the end of
this year as either a world index leader or a laggard.


Enjoy your weekend
and good luck next week!
N.B. I'll be posting a number of charts
showing support and resistance levels for a variety of instruments during the
course of the weekend, so please check my
Blog for that post.
