
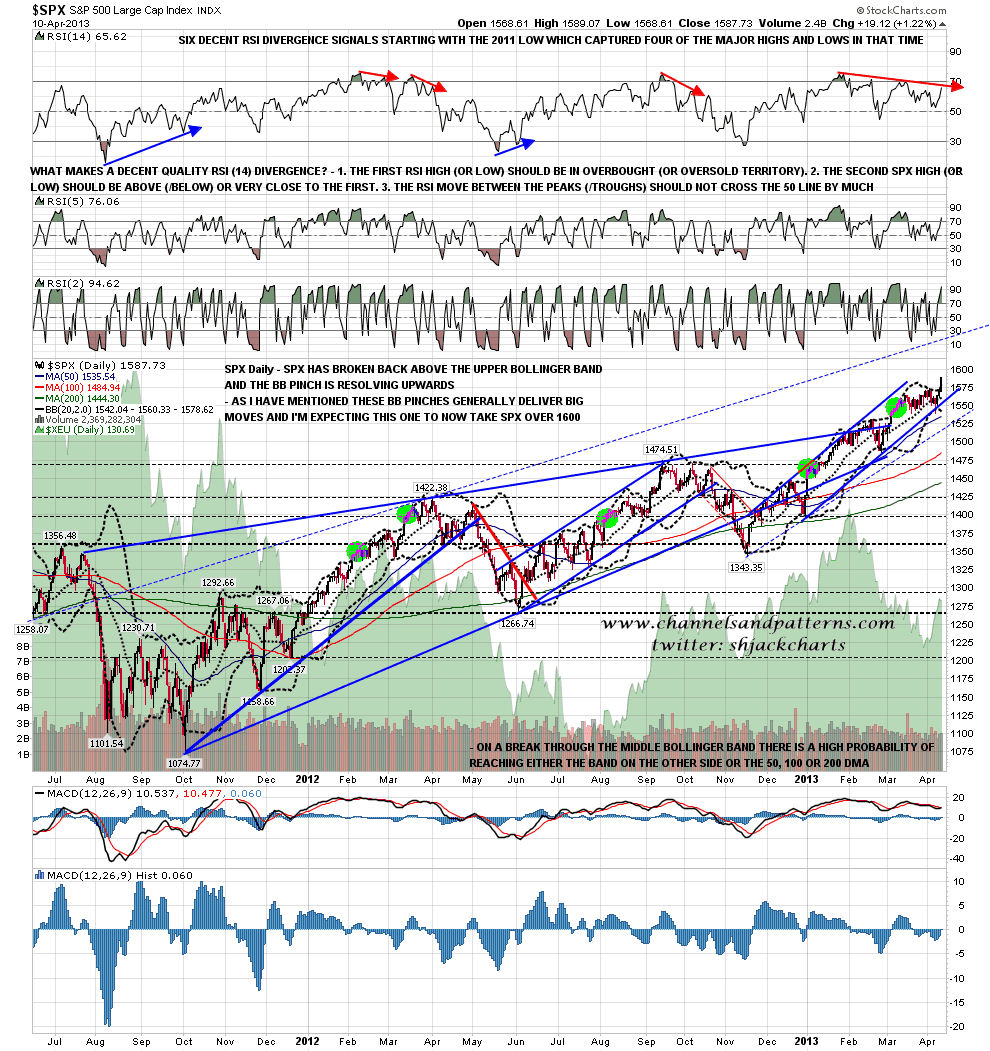
It’s been obvious for a while that the SPX 2007 intraday high at 1576 wasn’t likely to hold long, but I was expecting a bigger retracement before it broke. That was not to be and SPX broke and closed over resistance there with confidence yesterday. I’ve been looking at the daily bollinger bands pinching together on SPX for a couple of weeks now and noting that these tend to resolve into big moves. That big move should now be up so I’m expecting to see SPX over 1600 in the near future. SPX doesn’t tend to wander far from the upper bollinger band however, and that tends only to rise at five or six points per day in a strong move up. That closed at 1578 yesterday and the likely closing range would be at 1582-4 today, so with the close yesterday at 1587 I’m expecting to see some consolidation today:
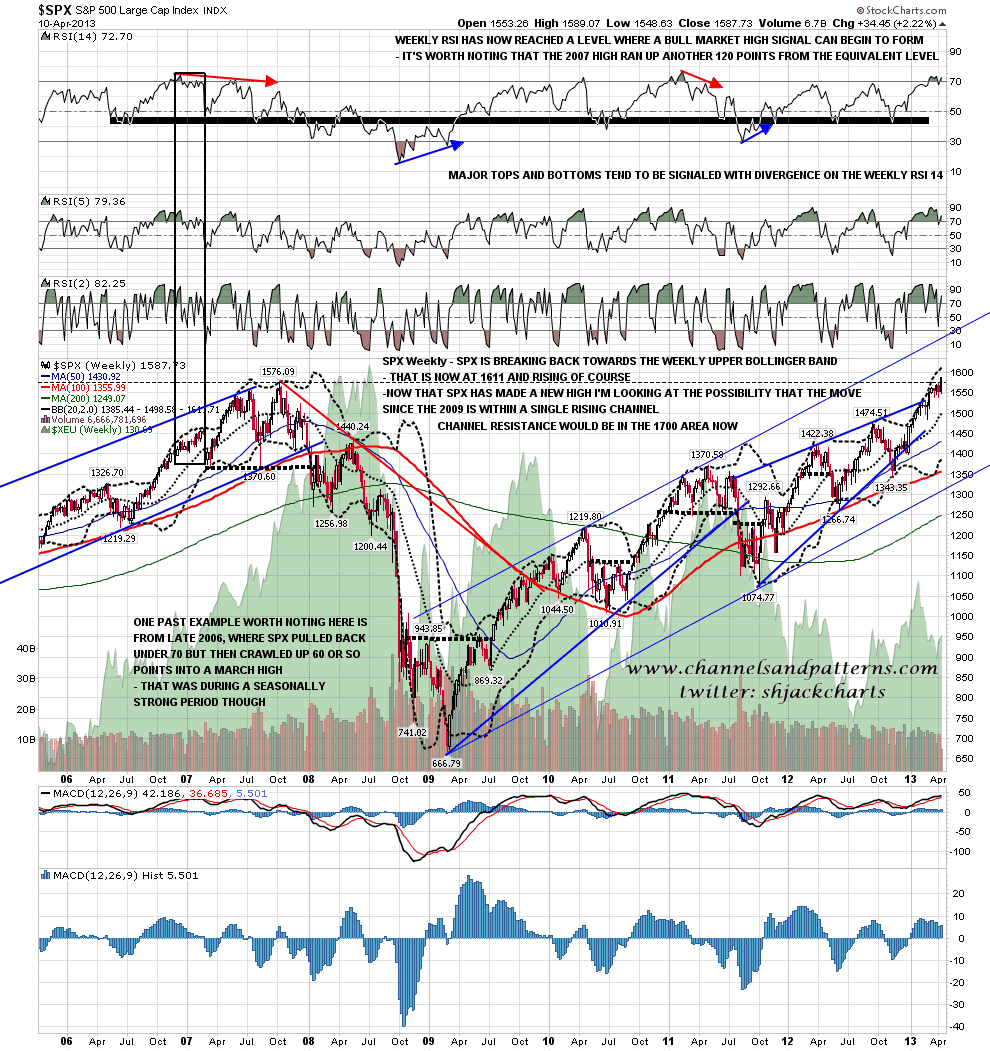
There is an obvious target for this move up, and that is the weekly upper bollinger band, now at 1611 and rising of course. Now that we have seen a confident break over the 2007 high I have drawn in a rising channel from the 2009 low on the weekly chart just to note that an obvious target for a cyclical bull market high in 2013-5 would be at the upper trendline of that channel, now in the 1700 area and rising about 150 points per annum. Thought for the day:
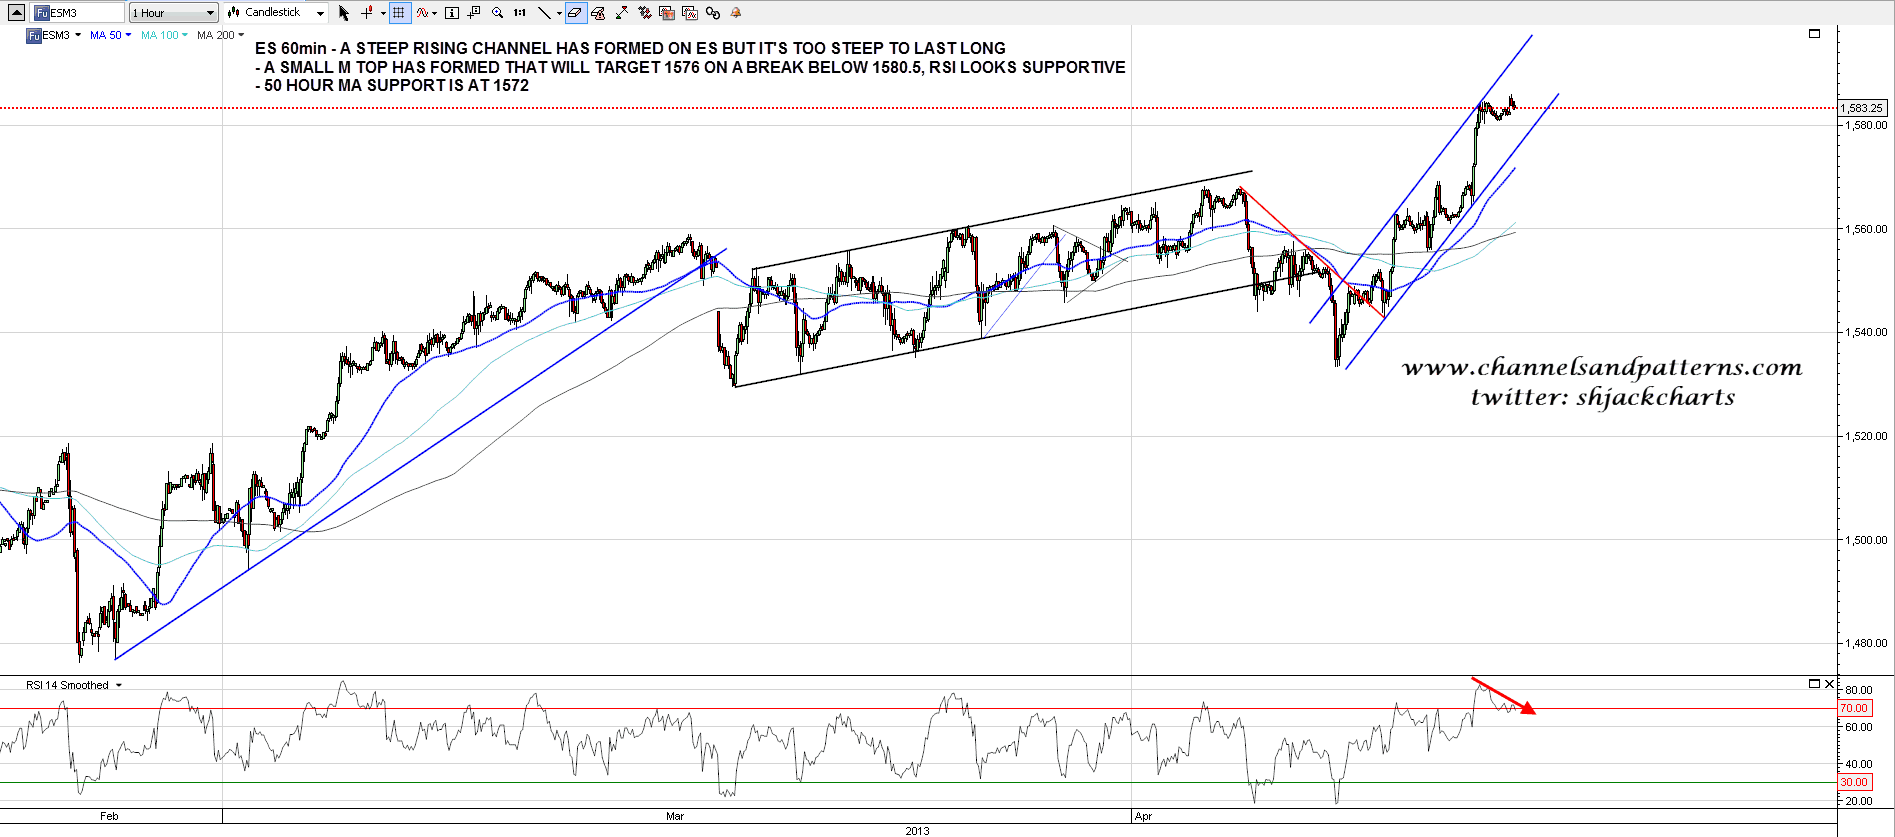
On the ES 60min chart a steep rising channel has formed from last Friday’s low, but it’s too steep to last long, and may well break today to establish a less steep and more sustainable support trendline. A marginal new high was made overnight on strongly negative RSI divergence and I have an M top target at 1576 on a break below 1580.50. The 50 hour MA is now at 1572, which would also be the right area to see a retest of broken resistance at the 2007 high:
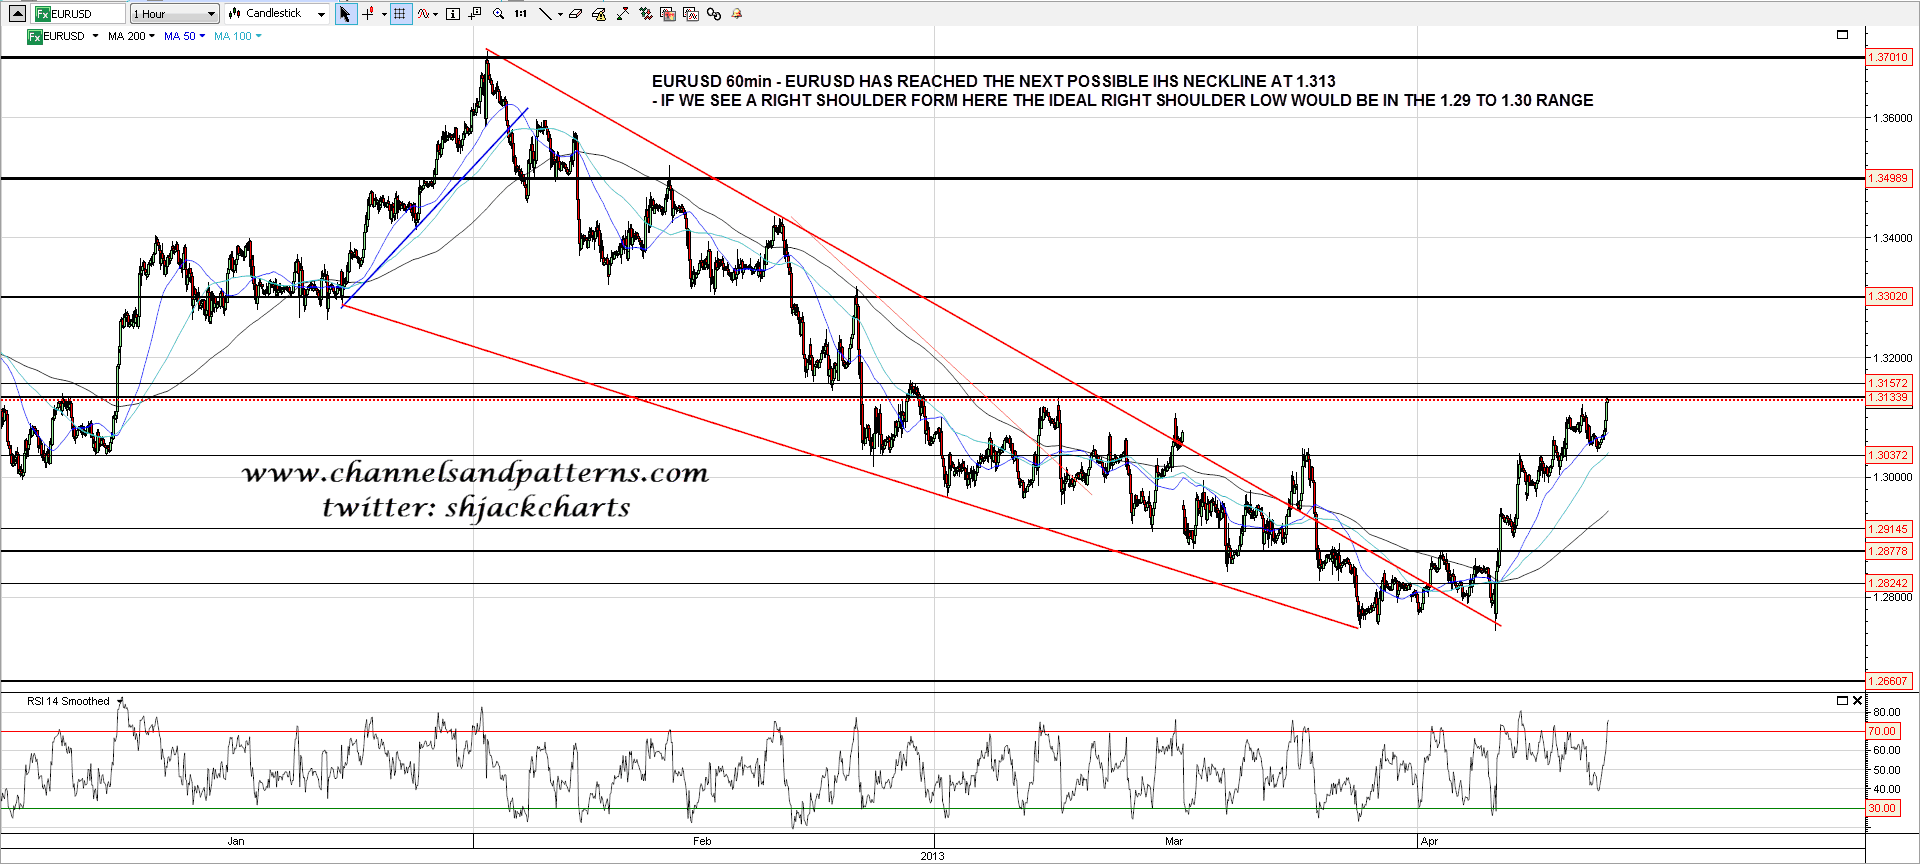
EURUSD has reached the next possible IHS neckline at 1.313. If we see a right shoulder form the ideal right shoulder low would be in the 1.29 to 1.30 area:
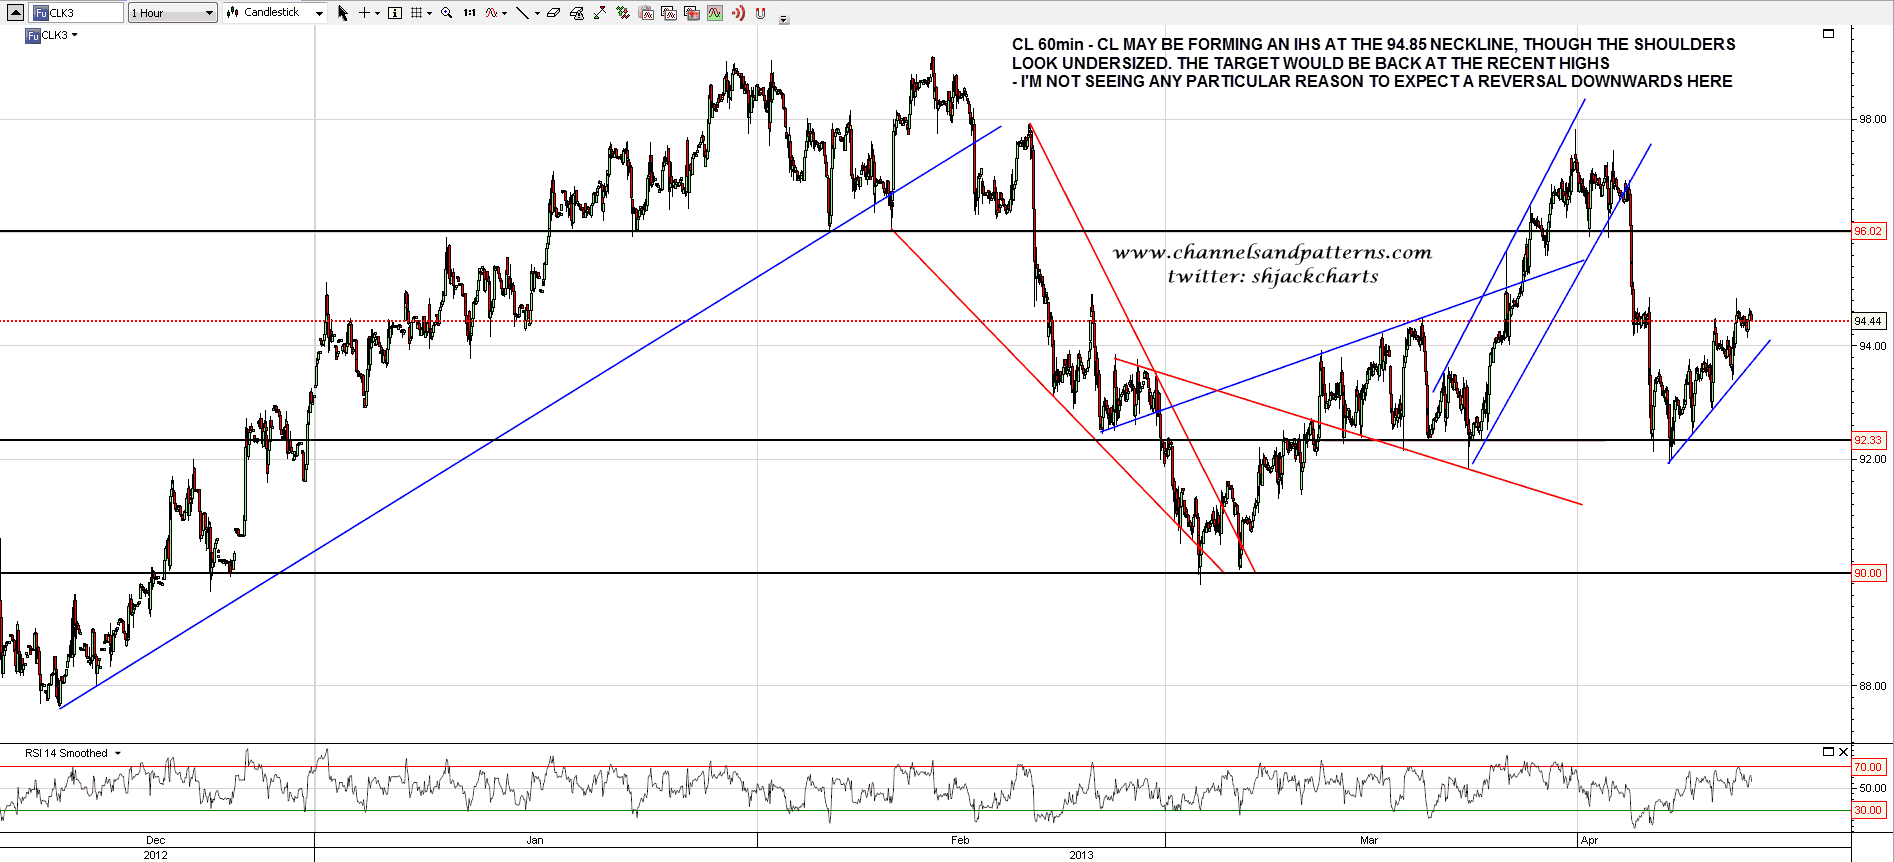
CL may be forming an IHS at 94.85 resistance, but the shoulders look very undersized so I don’t much like it. The target would be back at the recent highs. I’m not seeing any particular reason here to think that CL may reverse back down:
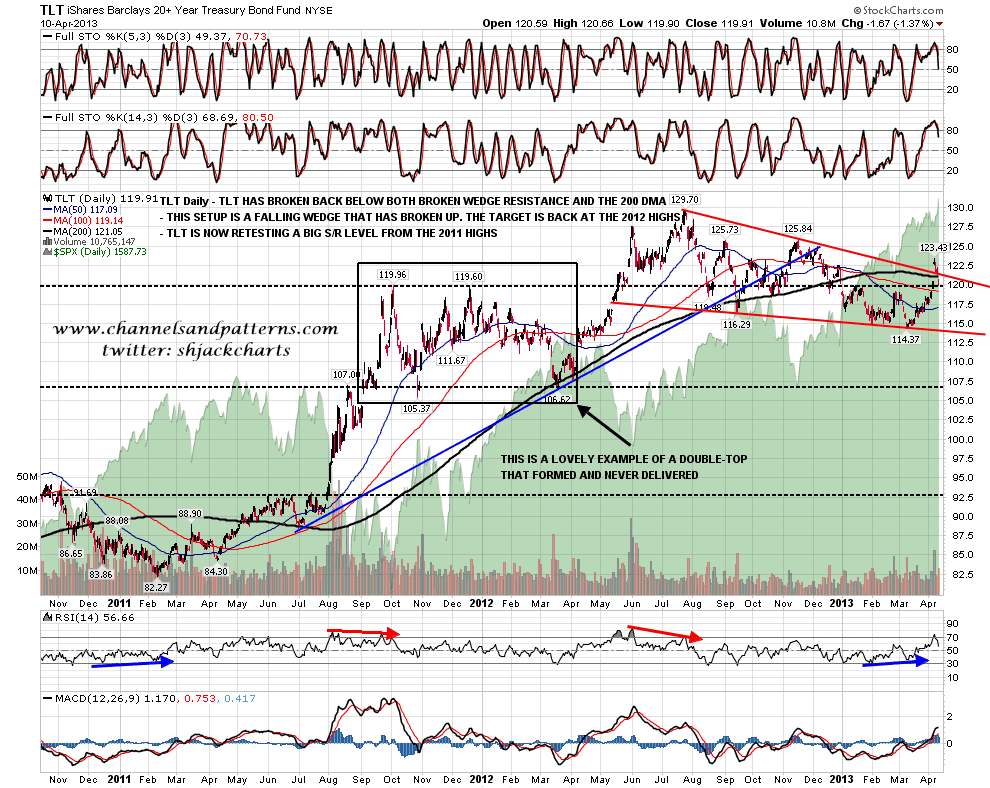
TLT broke back below both broken wedge resistance and the 200 DMA yesterday. This isn’t unusual on a bull scenario but it does open up the possibility that the break up over wedge resistance was a bearish overthrow. A break back below wedge support in the 114 area would look very bearish. Short term TLT is pausing at an established support/resistance level from the 2011 highs:
Something big changed on equities yesterday relative to the last few years, and that is that there are now no established resistance levels above on SPX. From here bollinger bands and trendlines will be our guides. I’m expecting to see some consolidation or retracement today.
