
All things pass on the markets, however long and strong, and it’s likely that this impressive move up from November is now ending. (Editor’s Note: Thank God.) The rising channel from November hasn’t broken yet, but I think it’s going to, and that the decline yesterday signals that we are now in the topping process for the usual Spring high.
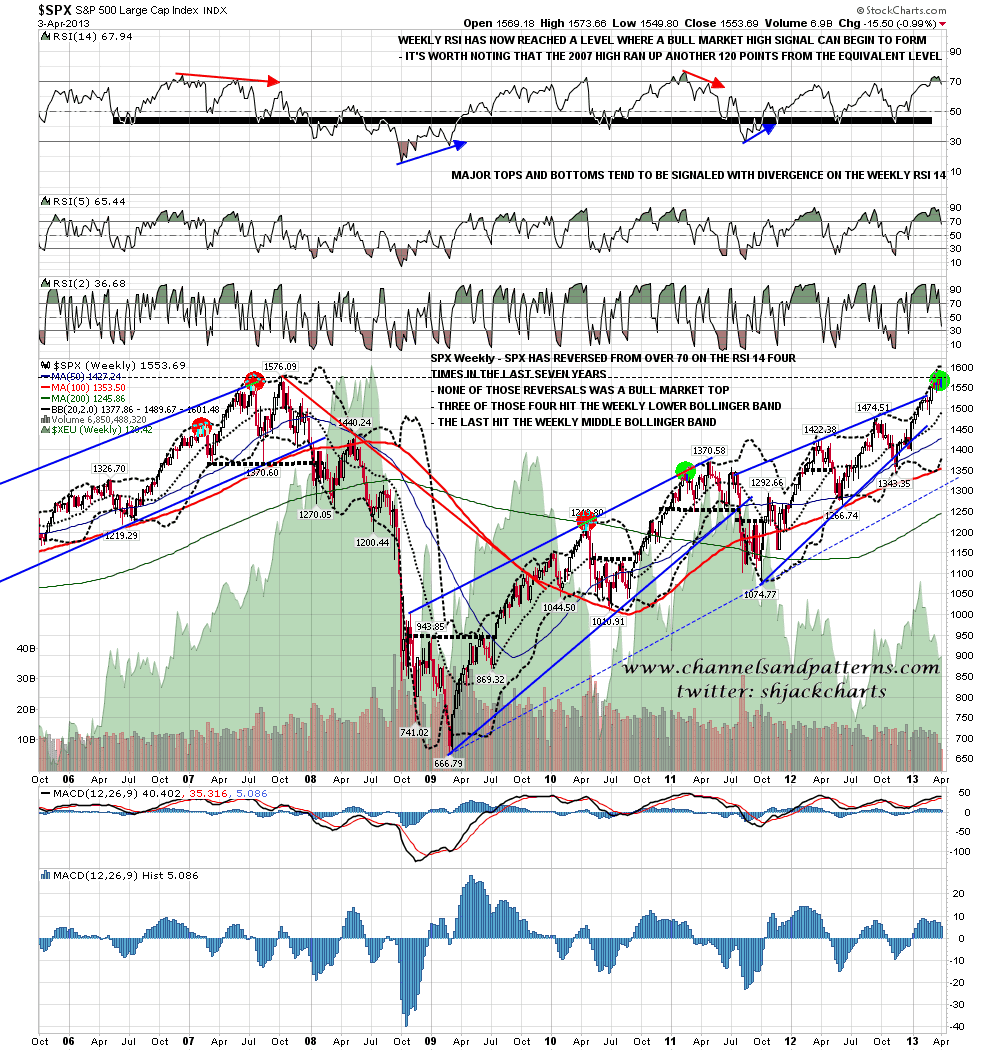
How far is this retracement likely to go? If I’m right about this being the Spring high, then there are only two main targets, and I am taking both from the weekly SPX. There have been four reversals in the last eight years from the weekly upper bollinger band when the weekly RSI 14 has reached over 70, and none of those was a bull market top. All four reached the weekly middle bollinger band, now at 1489, and three of those four reached the weekly lower bollinger band, now at 1377. That lower bollinger band may rise considerably by the time it would be reached however, and there is very strong support at the Spring high last year at 1422.38, as well as at the 200 day moving average now at 1438:
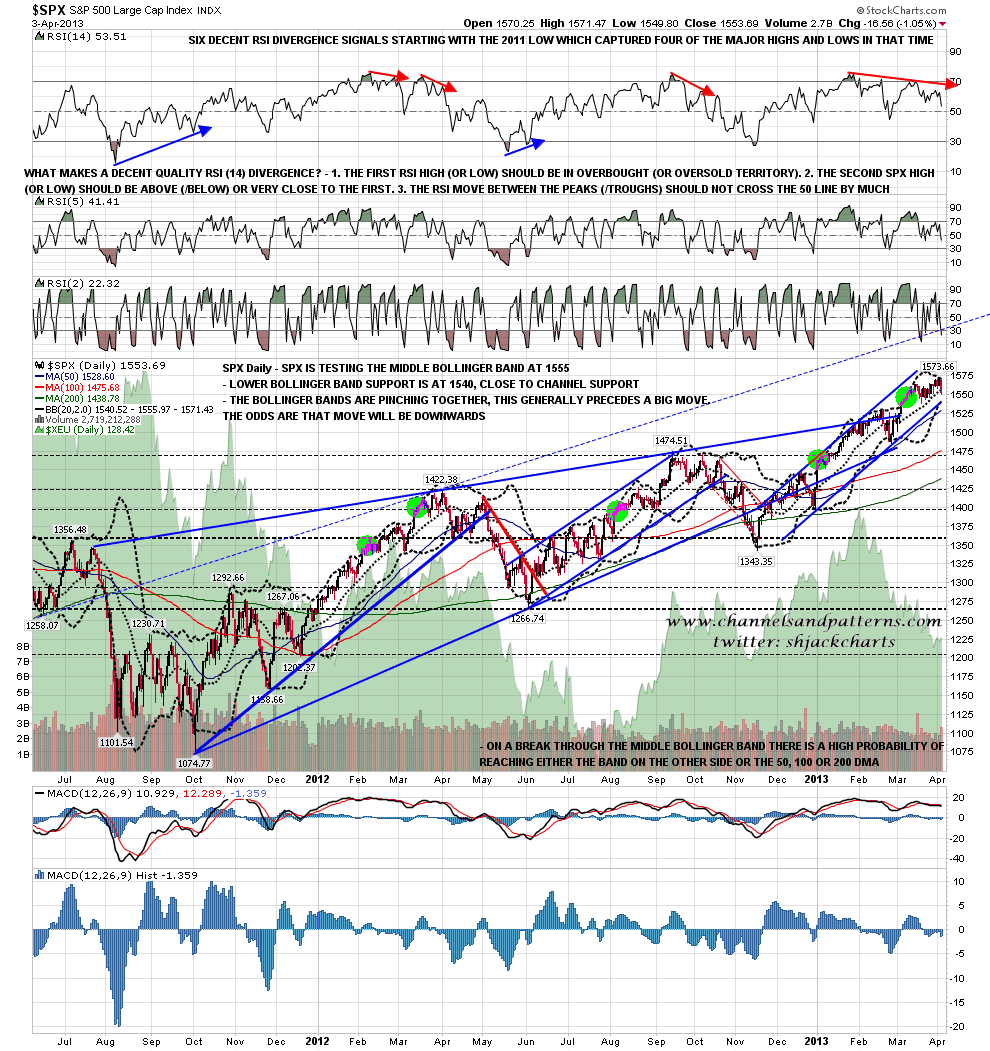
On the SPX daily chart SPX tested the daily middle bollinger band yesterday and the lower bollinger band is now at 1540, in the same area as rising channel support:
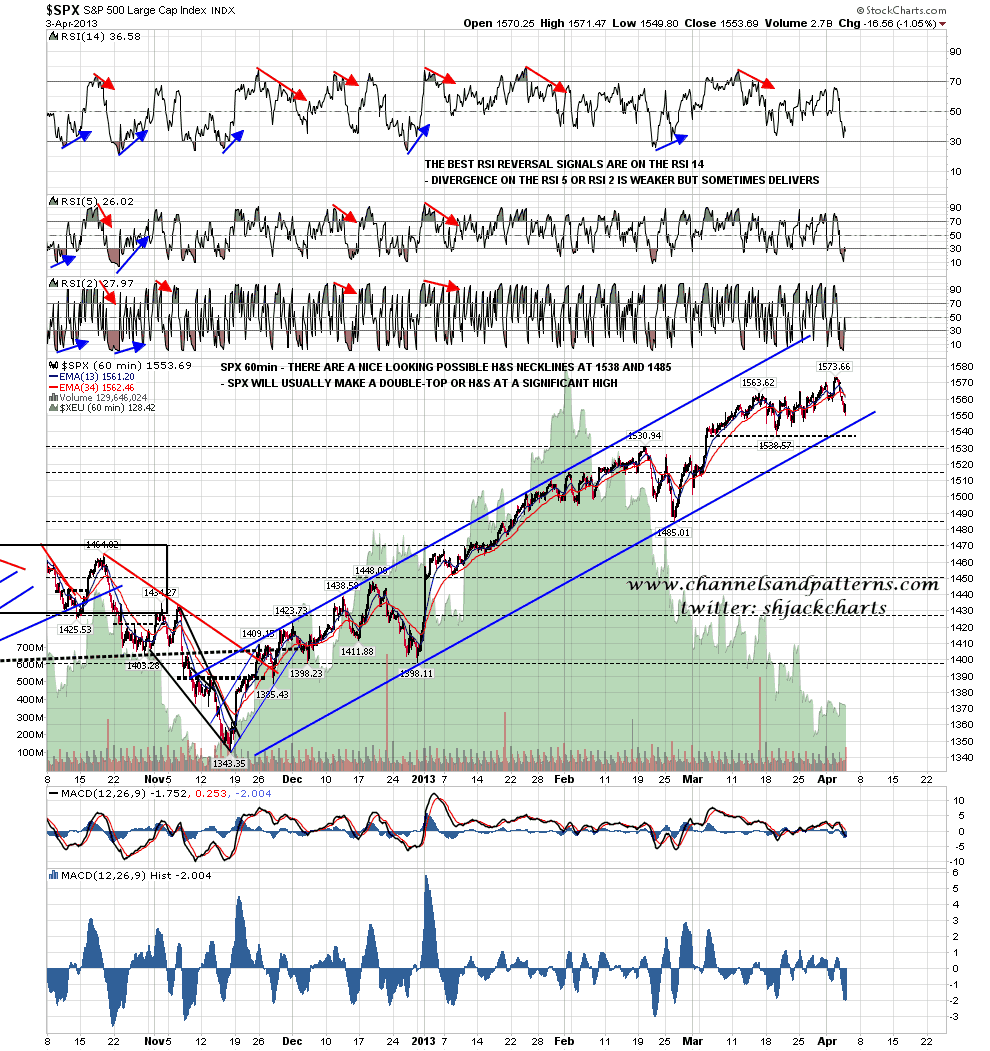
SPX usually makes significant highs with either a double-top or an H&S. There are two candidate H&S necklines here and they are in the 1538 and 1485 areas. A hit of the 1538 level would require a break below rising channel support which is now in the 1543 area:
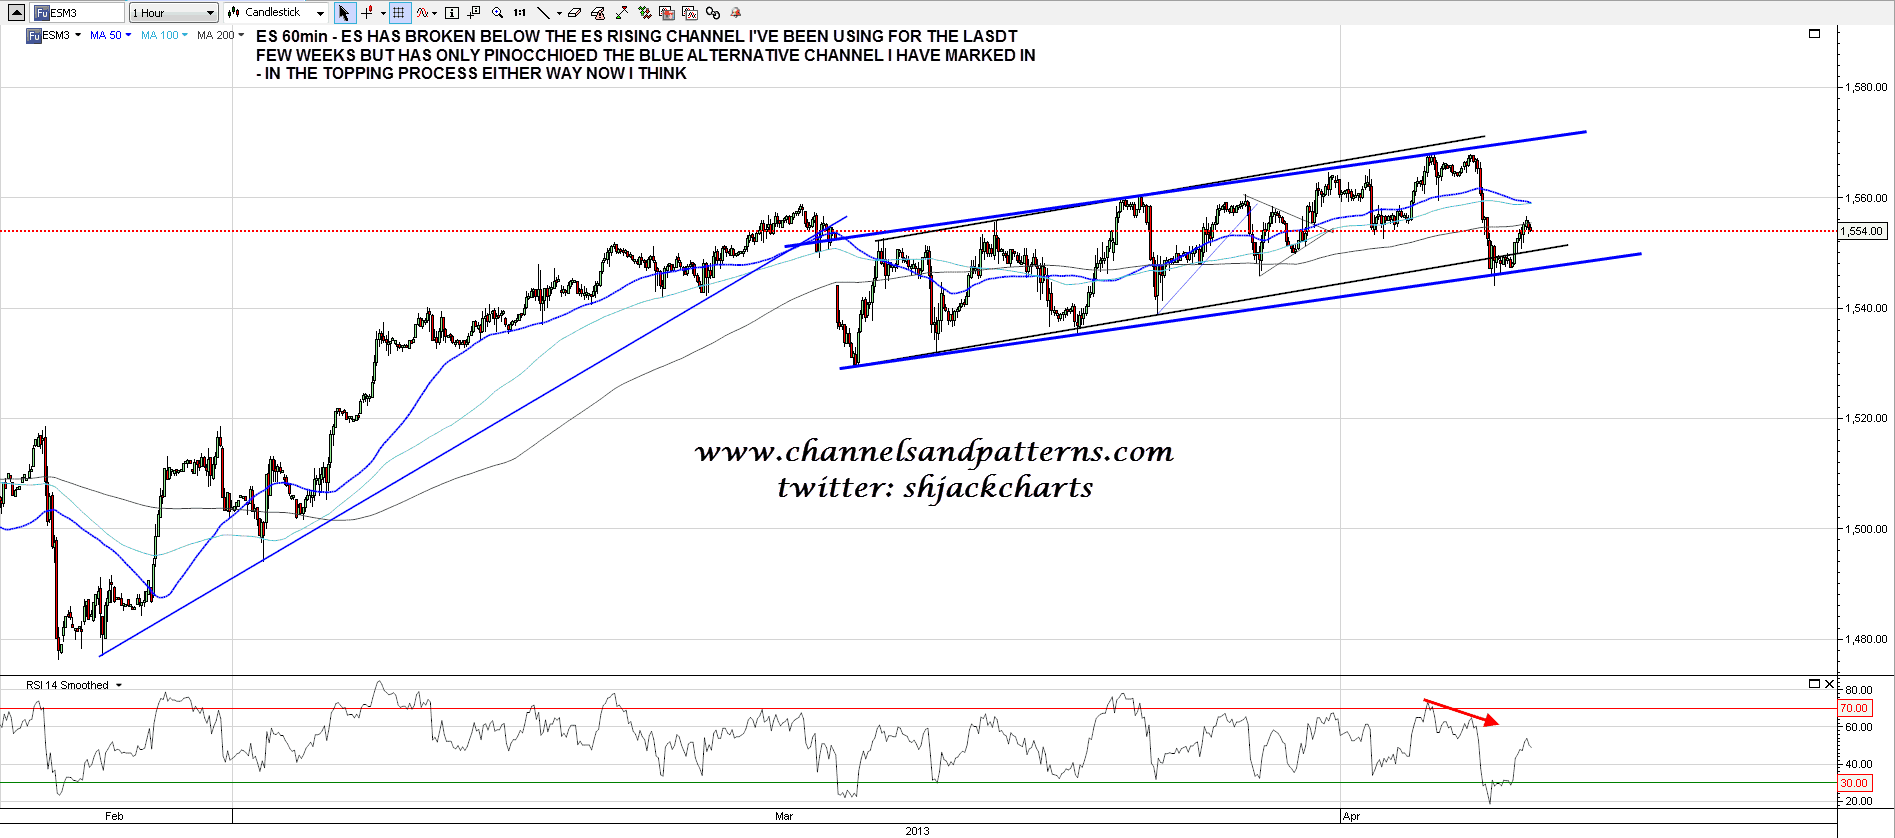
The smaller channel that I’ve been watching on ES broke down yesterday after the little double-top I was talking about yesterday morning broke down and made target. Looking at it again this morning though I have drawn in an alternate channel which has only been pinocchioed so far. Either way ES/SPX is now most likely in the topping process:
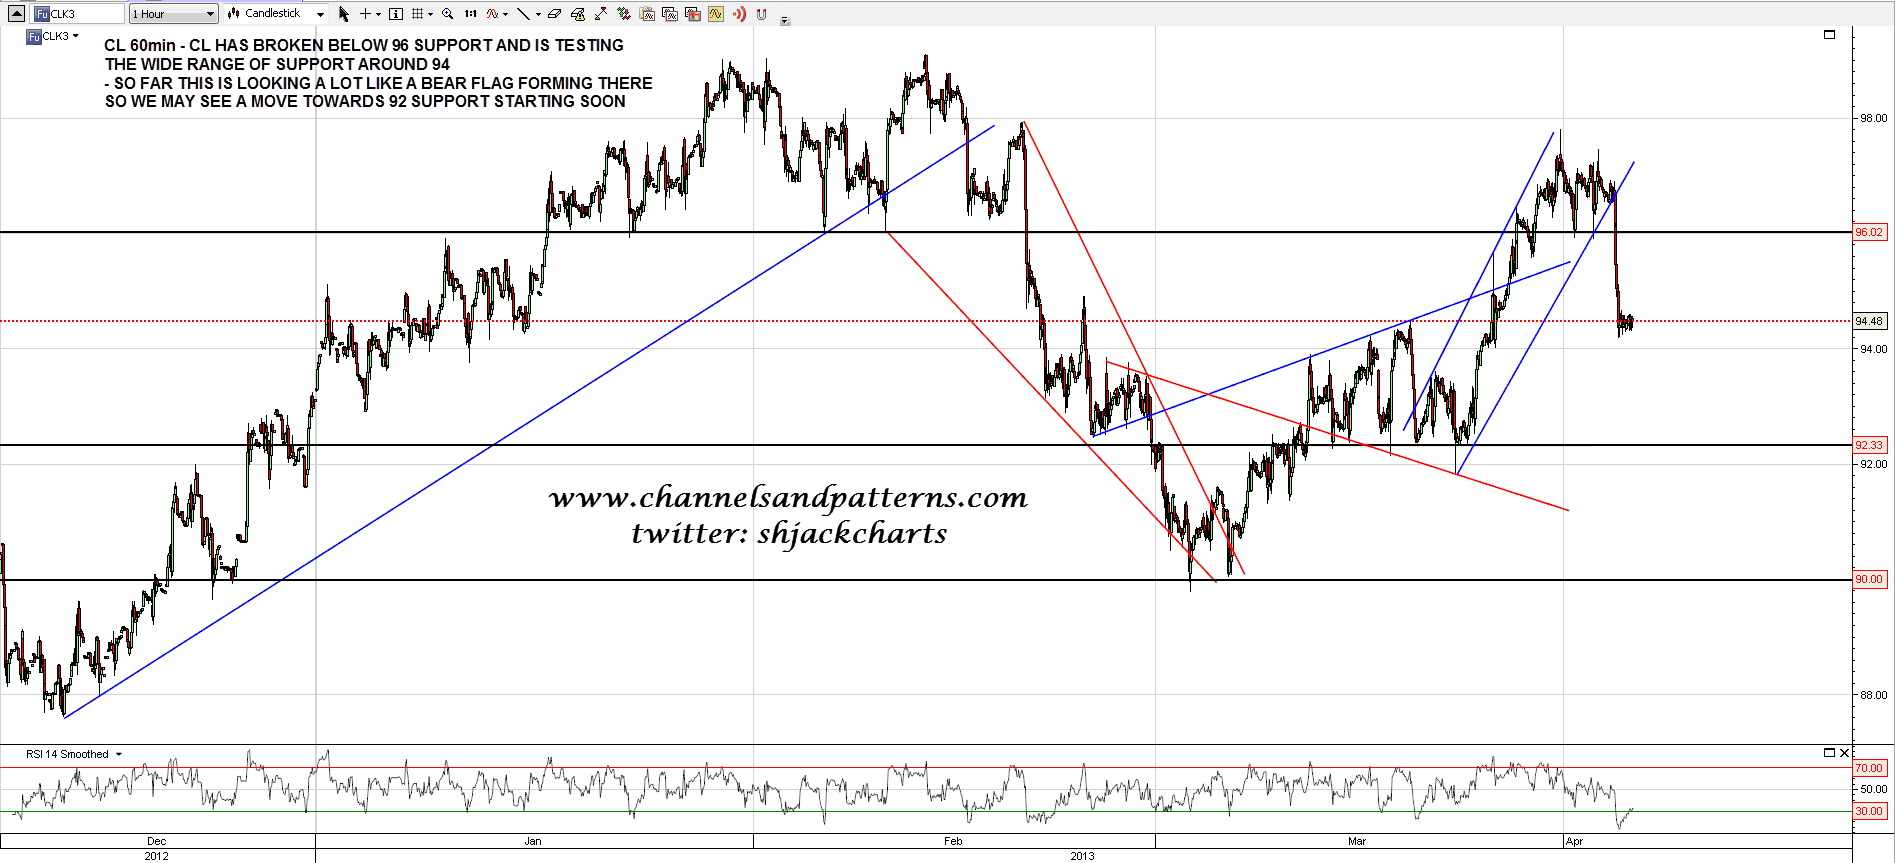
On other markets CL broke below 96 yesterday and is testing the wide range of support around 94. Looking a lot like a bear flag so far so we may well see 92 tested again soon:
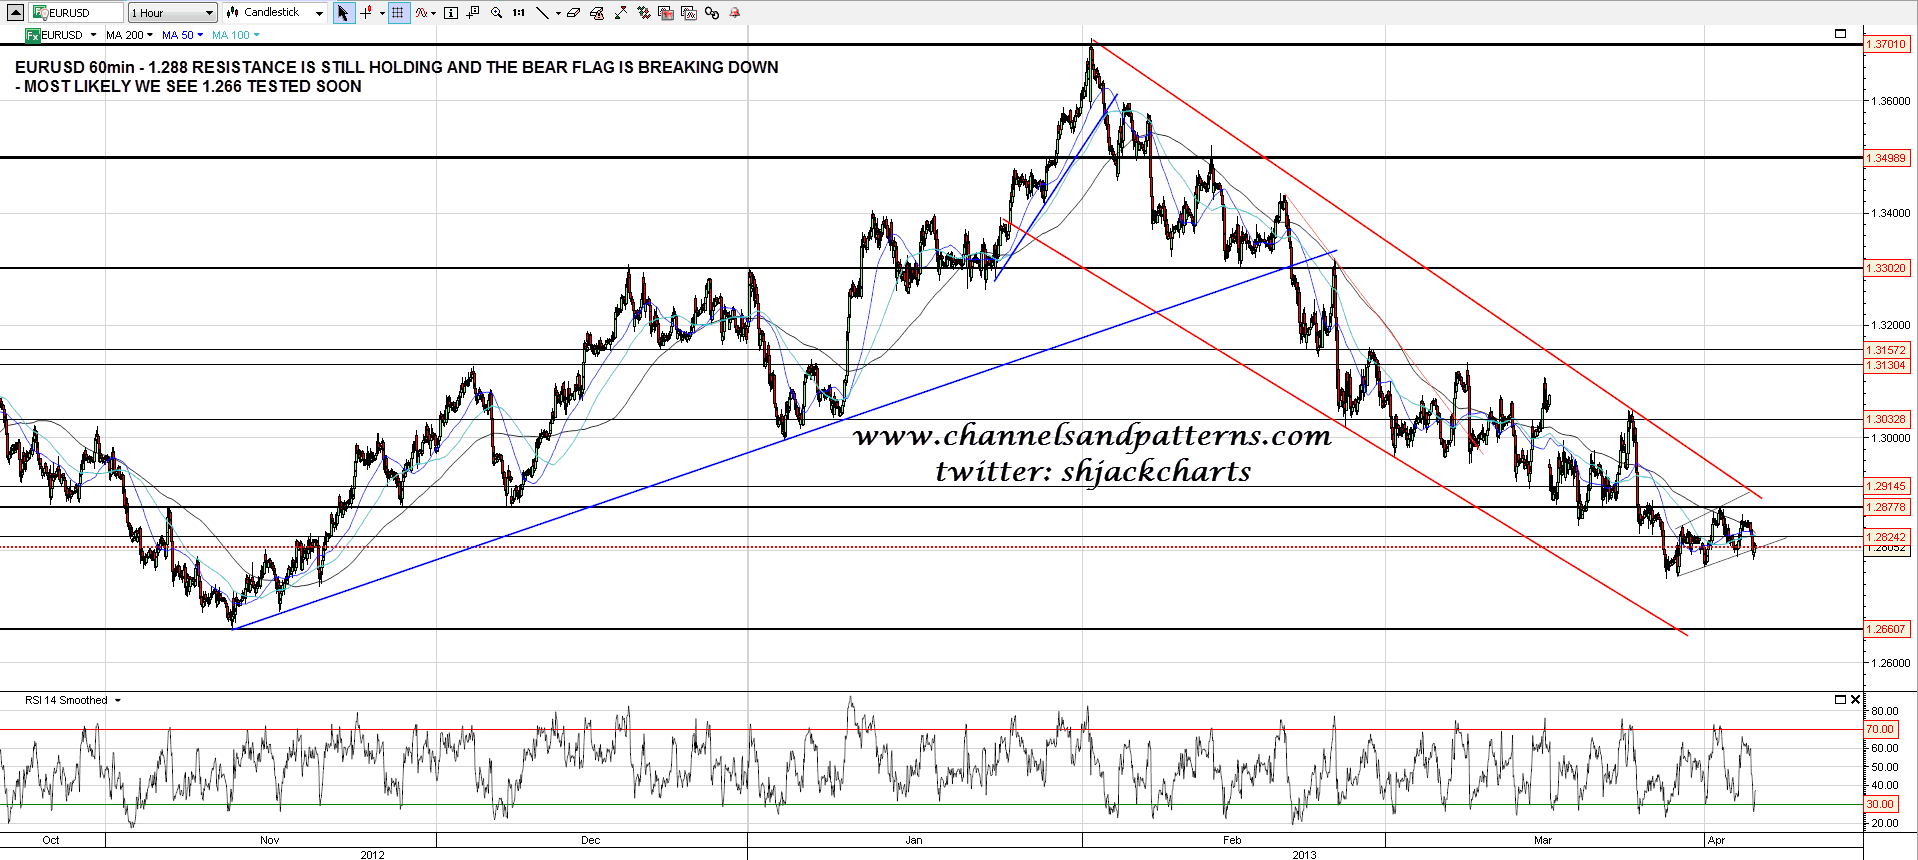
On EURUSD resistance at 1.288 is still holding and the bear flag there is breaking down. The next big support level is in the 1.266 area:
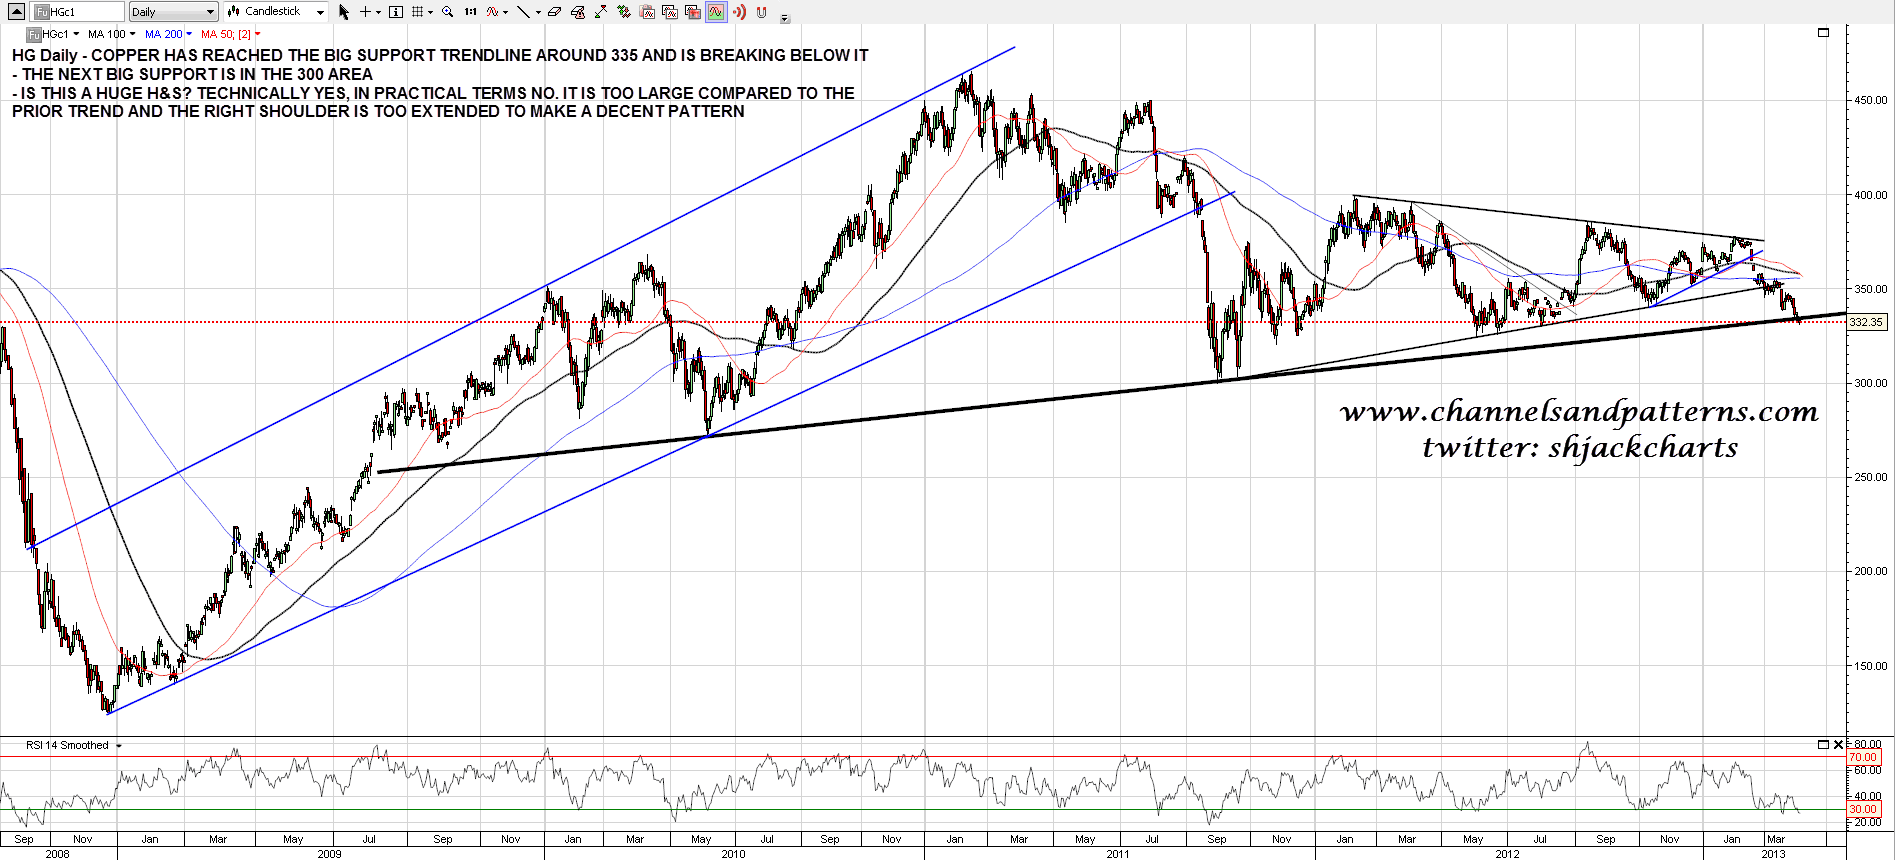
Copper has made my trendline support target in the 335 area and has broken below it. The next big support is in the 300 area:
How far is this retracement likely to go? Well we need to bear in mind both that this is most unlikely to be a bull market top from a technical perspective, and also that Bubble Ben Bernanke is still crouched over his digital printing press pumping $85 billion per month into the markets. We are likely to make it to test the middle weekly bollinger band, now in the 1490 area but very possibly over 1500 by the time it is reached, and I’m hoping we may see a test of the SPX 200 DMA, now at 1438 but rising as well of course. I would be surprised to see a break much below there. Meanwhile the bears can come out to play for a while, even if that’s only for a couple of laps round the prison exercise yard.
