
As we’ve been coming up to the ideal period to make a spring high, loosely from the last week of March to the first week of May, I have been carefully tracing through the options for such a high, watching support trendlines break, the first false alarm retracement at the 2007 high, and the formation of topping patterns from the current 1597 high.
I mentioned at the time that the 2007 high was broken that we were now out of established resistance levels on SPX but we aren’t yet out of resistance trendlines of course, and the current high is a precise hit of the biggest (and lowest) of those resistance trendlines, which is at rising resistance from the 2000 high through the 2007 high, as shown on the chart below. What I have also noted on the chart is the MACD histogram, which has been declining since January, and you can see the same sort of preparatory decline before the 2011 and 2012 spring highs:
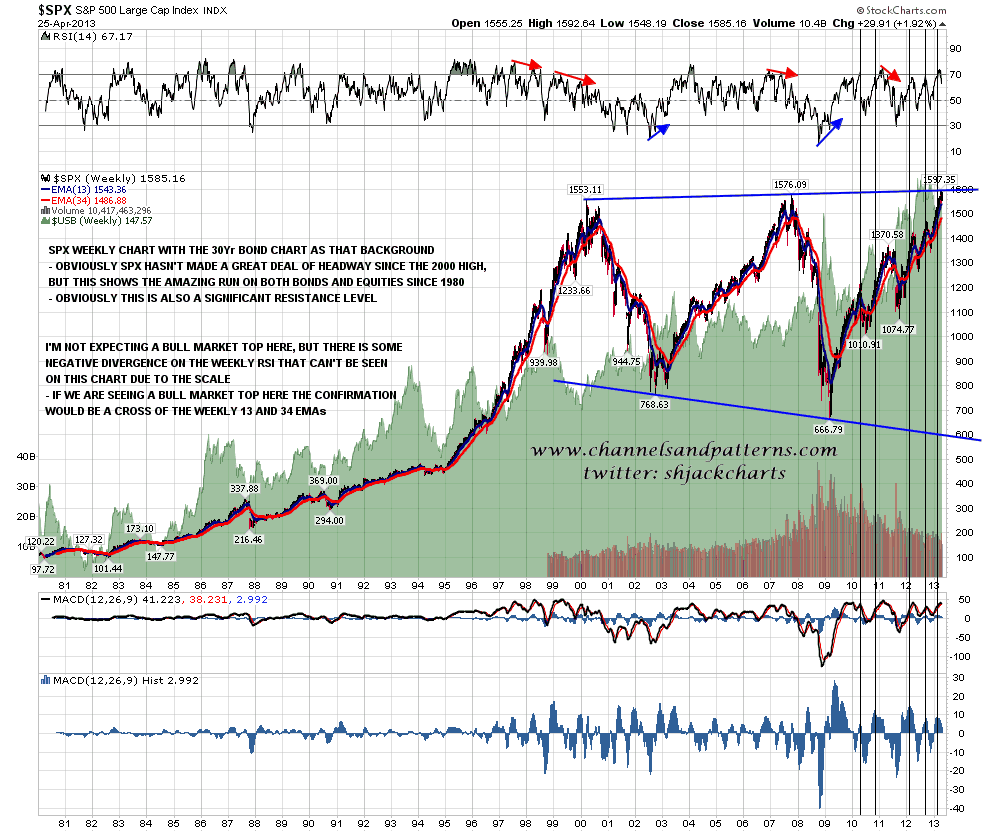
Could this be a bull market top? Possibly yes, as there is obvious serious resistance here and there is also some negative divergence on the weekly RSI, though due to the scale that’s not visible on the chart above. If it is a bull market top we would see confirmation over the summer from a cross of the weekly 13 and 34 EMAs, but until we see that this is just a possibility to bear in mind.
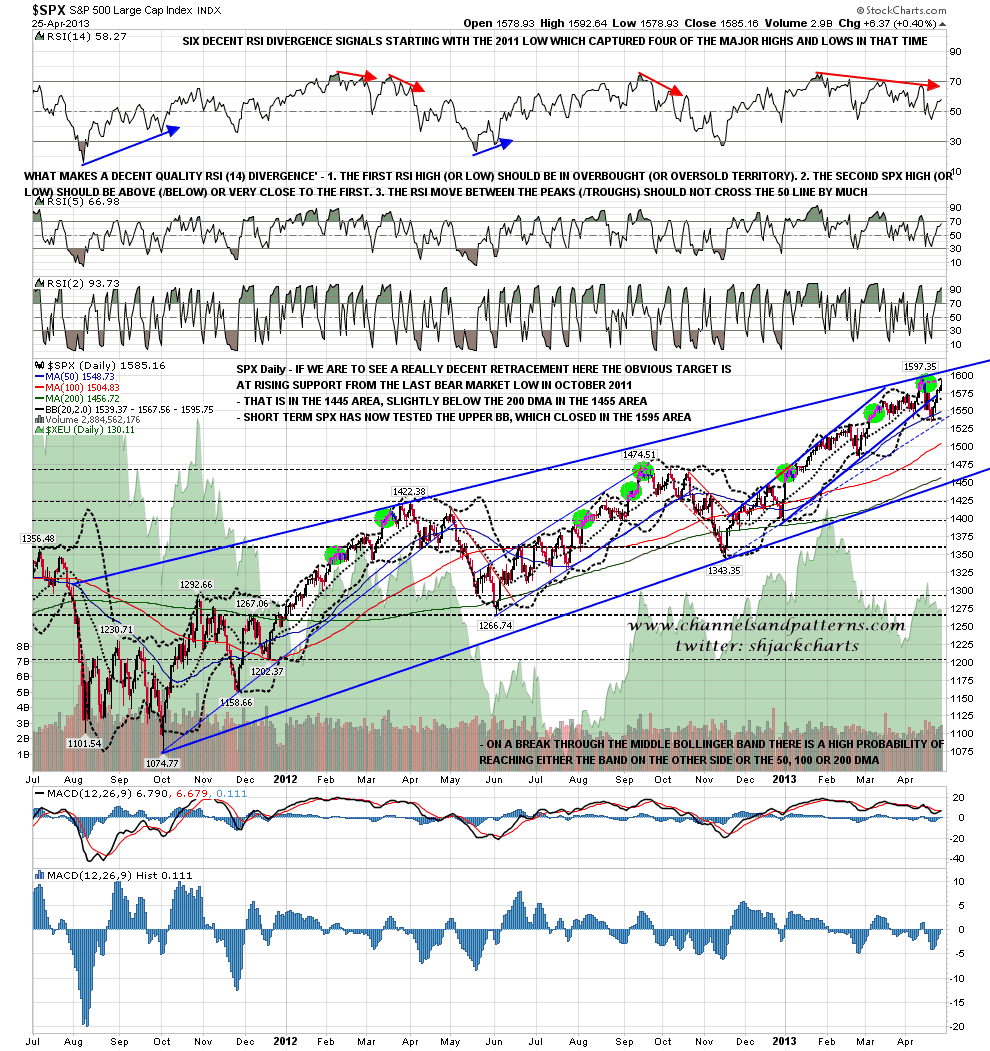
On the SPX daily chart the upper bollinger band was tested yesterday, and if we’re going to see a big reversal then this is the obvious place to see it, either at the high yesterday or at a closer test of the current high today or on Monday. The upper bollinger band closed at 1595.75 yesterday:
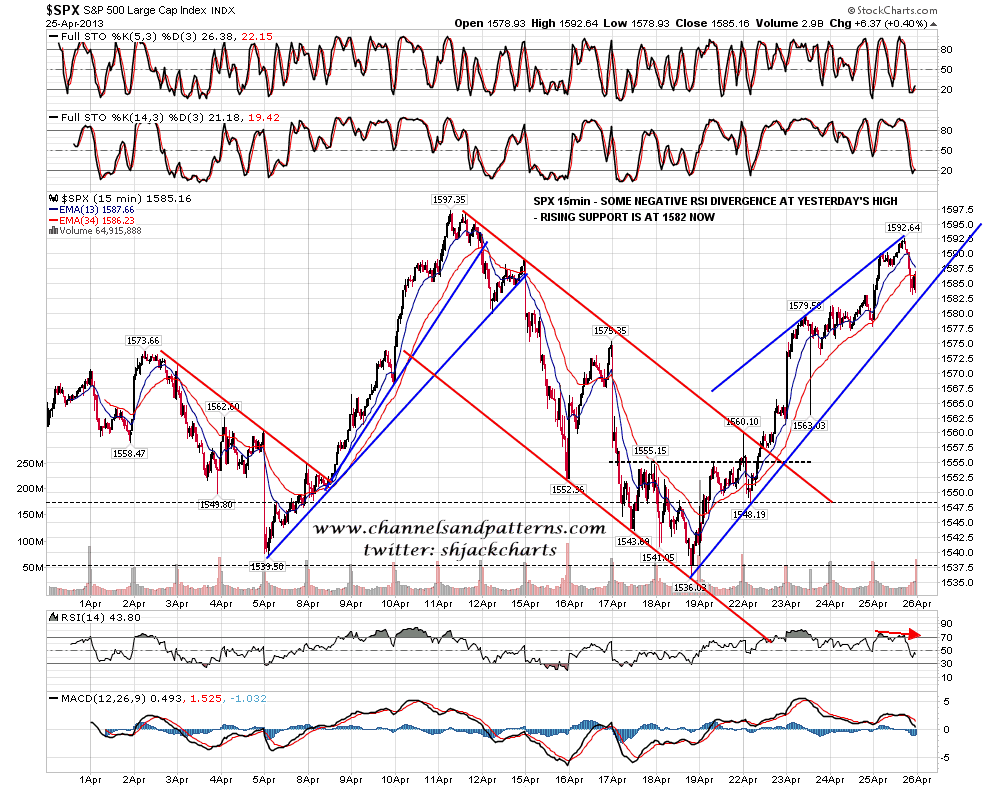
There’s currently no negative divergence on the SPX 60min RSI, though there is divergence on the SPX 15min RSI. If we are to see reversal here then first support is rising support from the low last week and that’s now in the 1582 area. I won’t show the SPX 60min chart today but a high here would in my view be a double-top rather than an H&S. Here’s the SPX 15min chart:
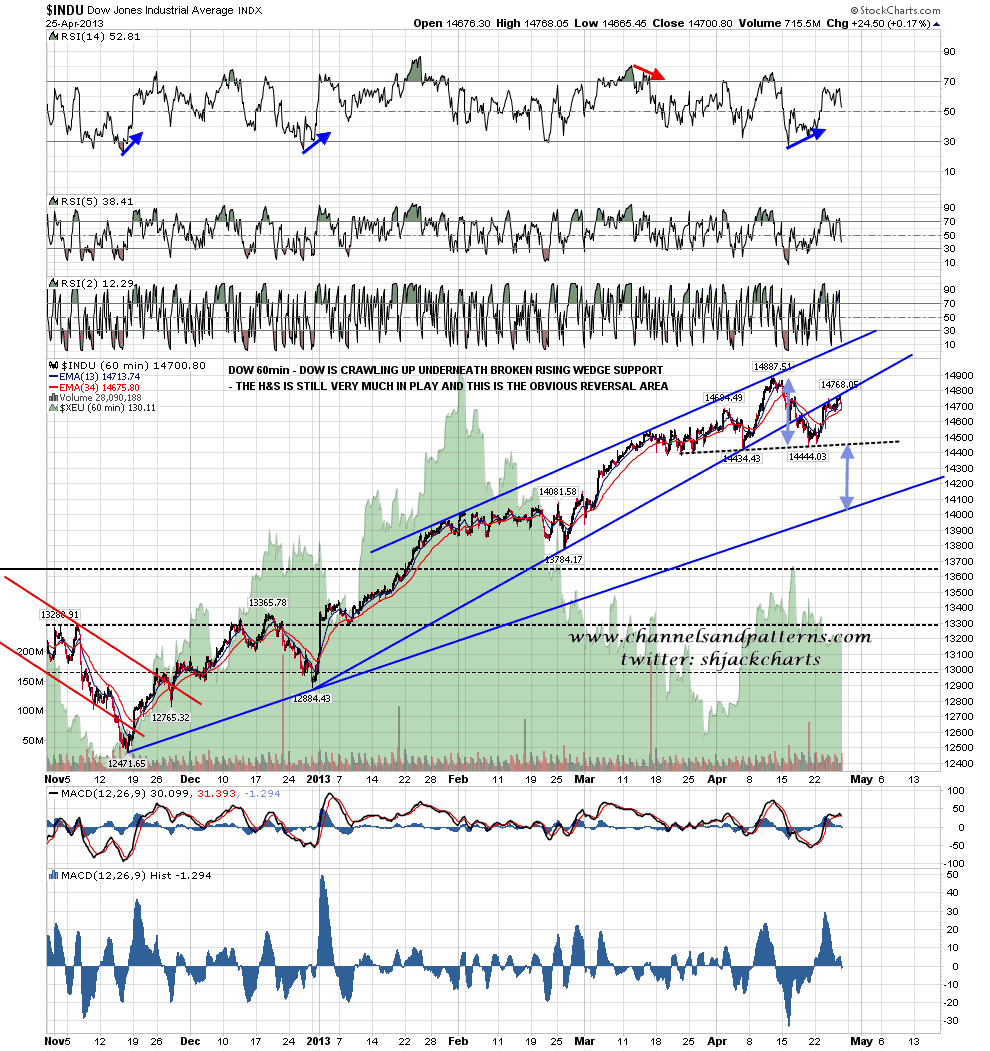
Other indices are looking promising for reversal here. I’ve been ignoring NDX as the setups have been less clear but there are now decent candidate double-tops on NDX and COMPQ. Dow is crawling up broken rising wedge support and the part-formed H&S there is still very much in play. The H&S target on Dow would be at or very close to rising support from the November low in the 14050 area:
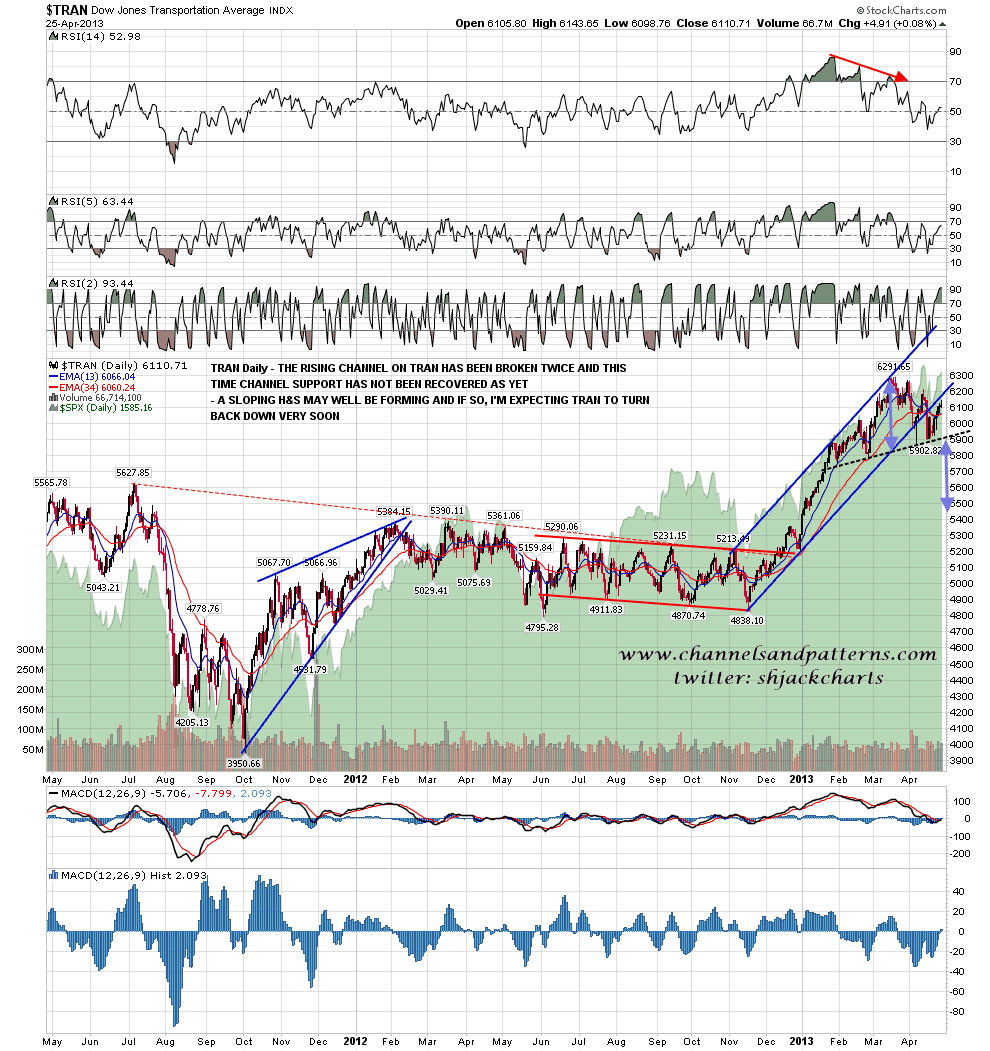
The H&S forming on TRAN is still very much in play with a target in the 5450 area and the likely failure area at broken channel support in the area of yesterday’s high:
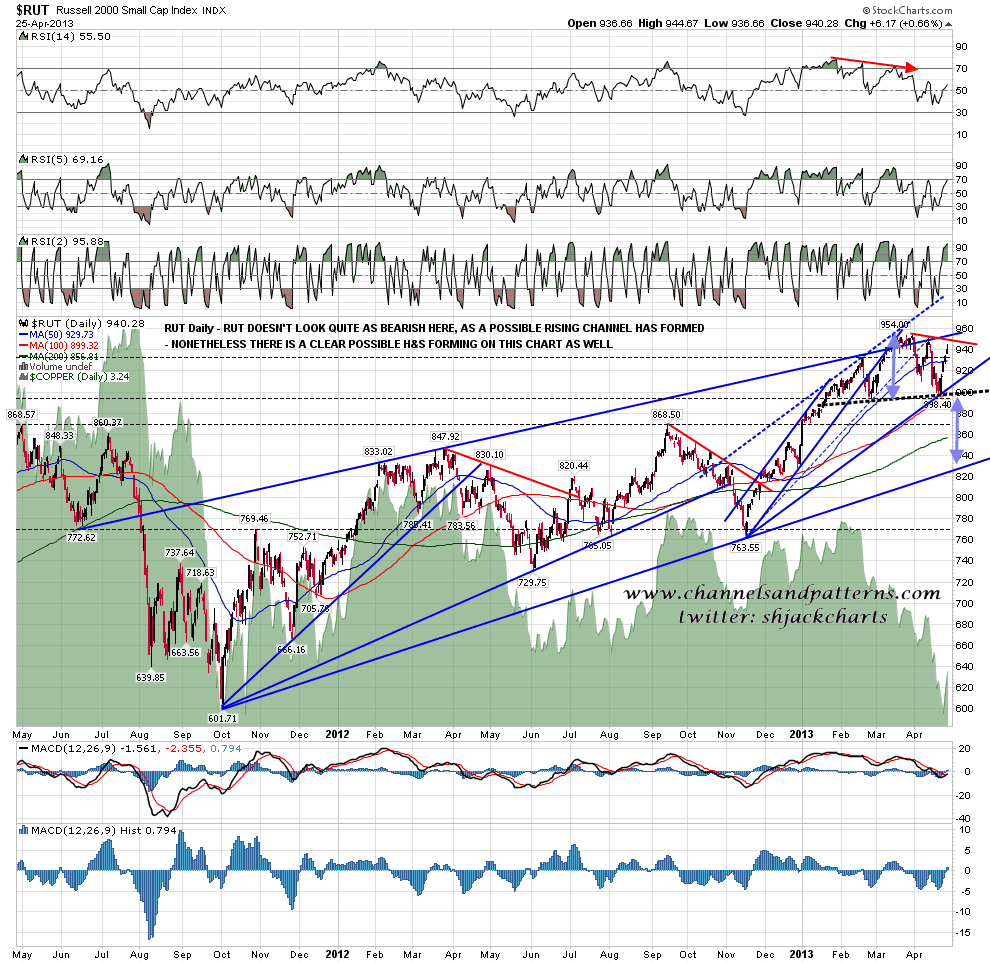
With the caveat that a larger rising channel may have formed (another possible one of those on COMPQ), the H&S forming on RUT is still very much in play, with the obvious failure level slightly above yesterday’s high at declining resistance from the highs. The target would be at or near rising support from the October 2011 low in the 830 area. In the event that we are looking at a bull market top here, and I would stress that I’m not looking for that at this stage, then that support trendline on RUT would break:
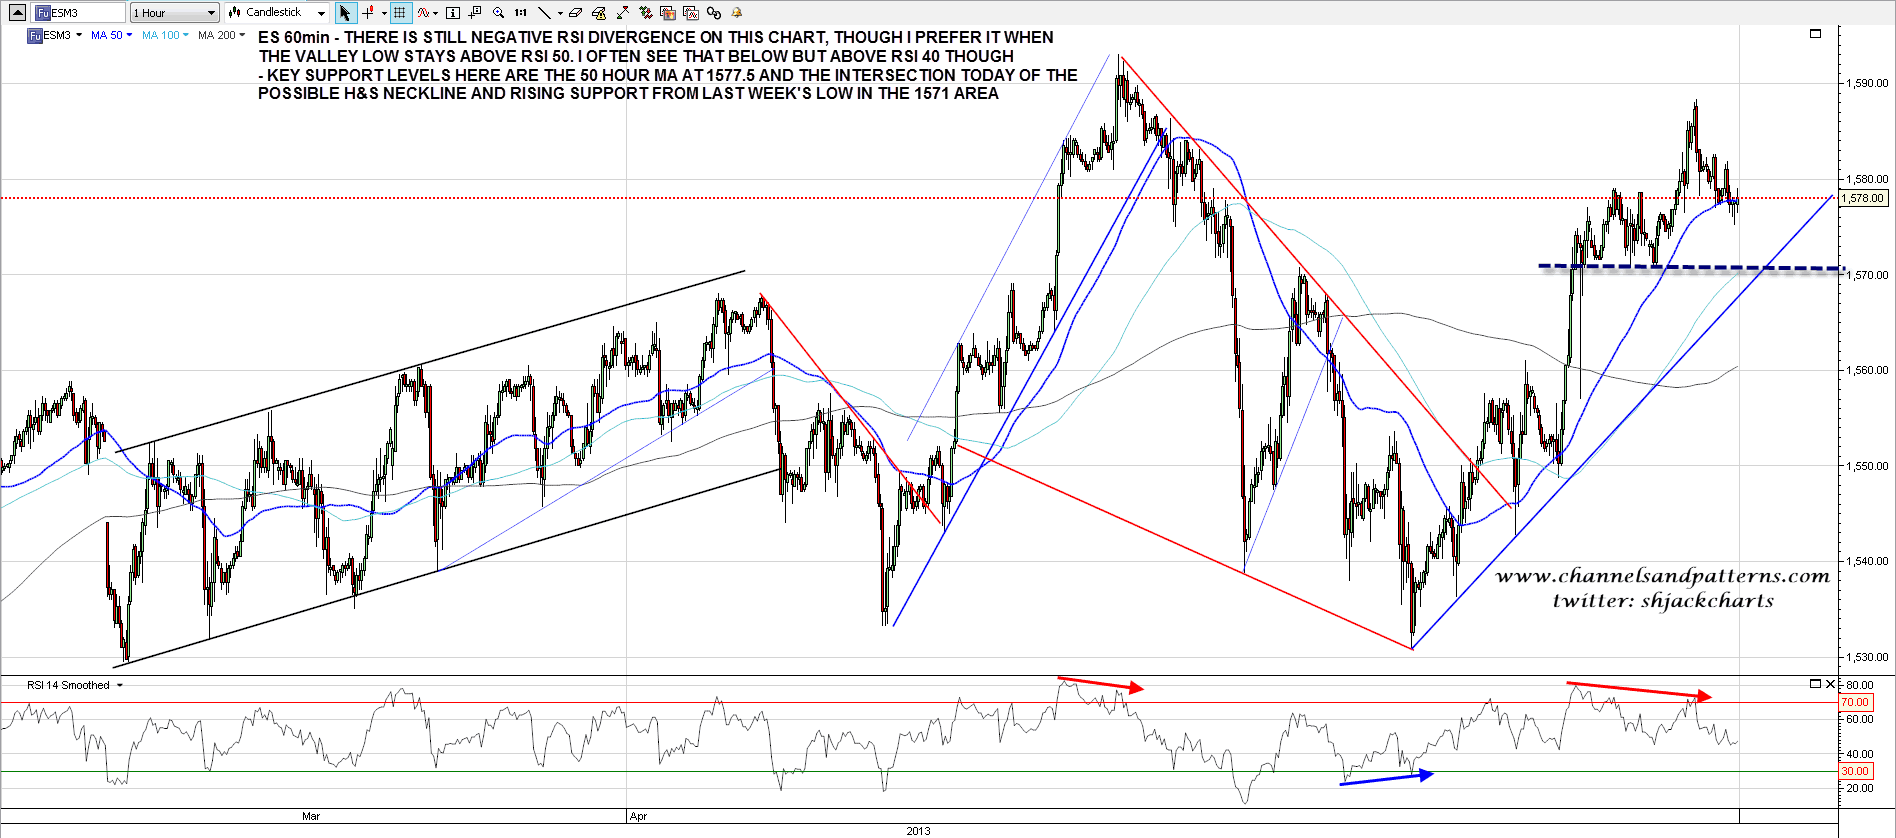
Looking at the ES chart there is still negative 60min RSI divergence at the high yesterday. I prefer that the valley low for divergence stays above RSI 50, but in practical terms it’s still acceptable over RSI 40 so this is still in play. The key support levels for today are the 50 hour MA in the 1577.5 area, being tested at the moment, and the intersection of a possible H&S neckline and rising support from last week’s low in the 1571 area. Last week’s low was nicely signaled and confirmed with RSI divergence, a falling wedge from the high, and a strong resistance trendline that broke up. The setup for reversal back down here is not as good as that yet, but that’s often the case:
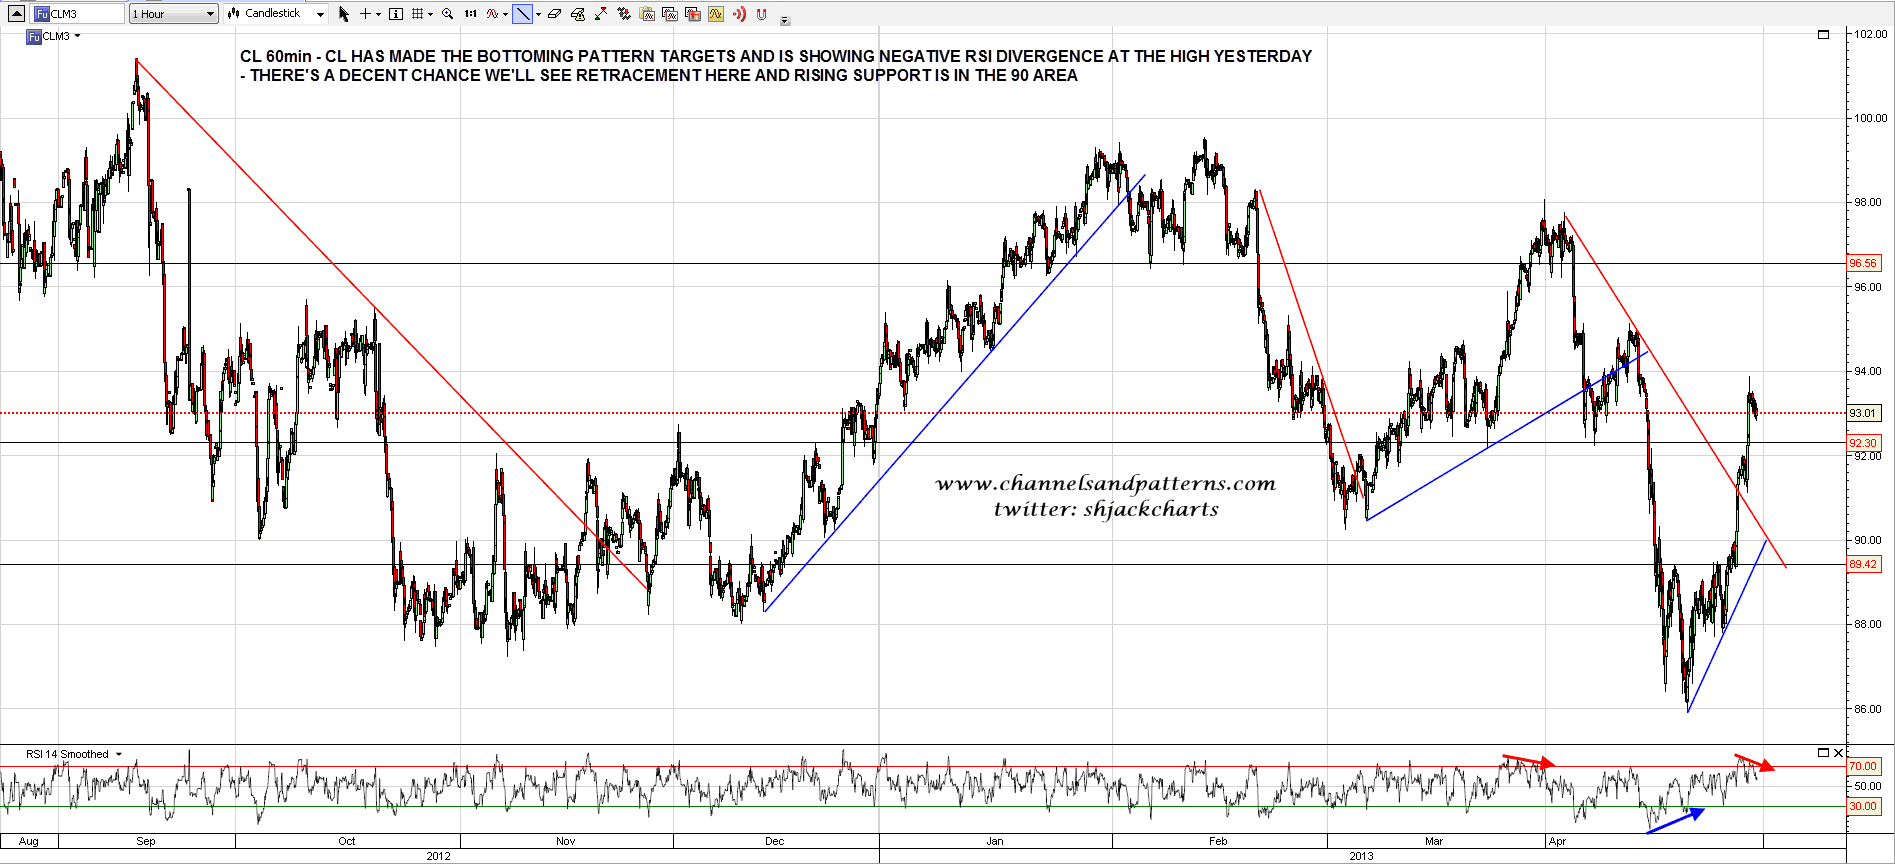
EURUSD is doing nothing worth the mention so I will skip that chart again today. CL made the bottoming pattern targets yesterday and is showing negative divergence at the current high. I’m looking for some retracement here and rising support from the low is in the 90 area:
The arguments for a spring high here in summary:
– A big resistance trendline reached on SPX
– Negative divergence on the daily RSIs across multiple indices
– A retracement on SPX here would generally reach the 200 DMA area, slightly below the candidate double-top target
– Coming to the end of the ideal topping time period
– Support trendlines have broken across multiple indices
– Reversal patterns are forming across multiple indices
The arguments against a spring high here in summary:
– Having formed a clear left shoulder, I would have preferred an H&S to form on SPX here
– The Fed is still printing $85bn per month with no date announced for an end to that
Mainly this comes down to whether the Fed printing money can override the normal technical rhythms of the market. I think not, as we’ve seen no real evidence of that over the last few years, though it’s worth noting that the 2010 spring high came at the end of QE1 and the 2011 spring high (and cyclical bull market top) came two months before the end of QE2. We shall see. If SPX continues straight up here then that I will start taking this theory more seriously, with the note that as and when QE infinity comes to an end, as it is likely to sometime in the next few months, I would expect to see a major high at or shortly before the Fed stops printing. If the market is that heavily reliant on Fed printing then when that printing ends a lot of air should come out.
If we do see a spring high here then I would expect the retracement to last weeks and the obvious target is the 200 DMA on SPX, which closed yesterday at 1456.
