
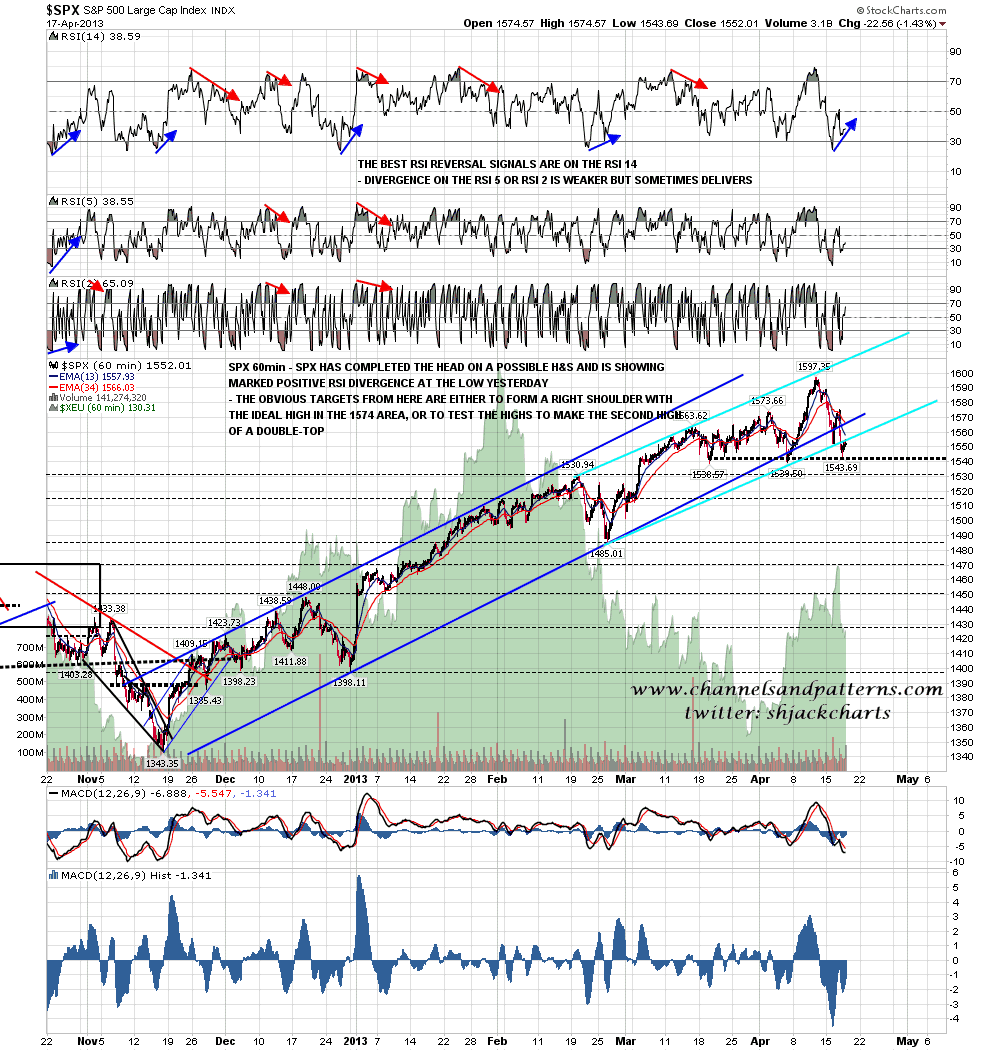
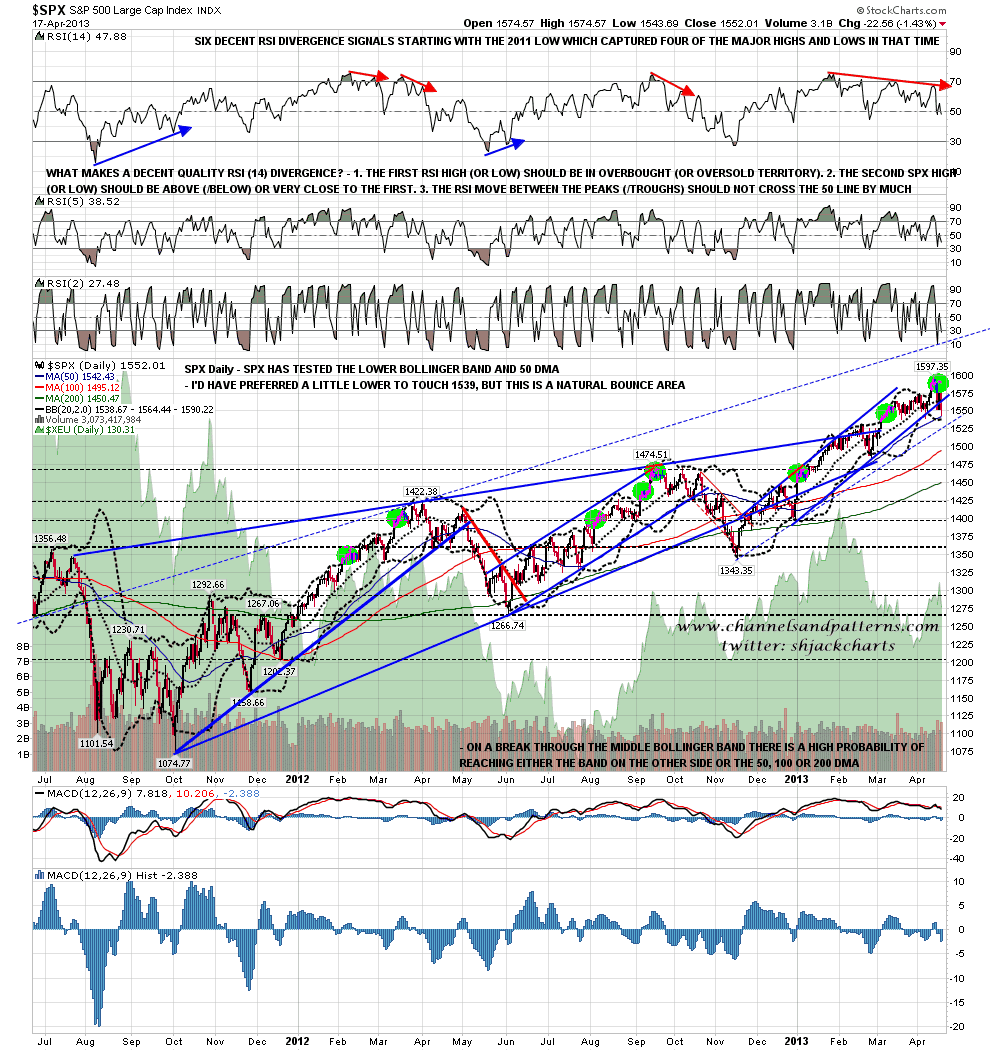
SPX didn’t quite make my ideal H&S neckline at 1539 yesterday, but the low at 1543 was a viable completion of the head on a candidate H&S and the positive RSI divergence at the low suggests a strong bounce here. The ideal targets for that bounce would be either the 1574 area to make the right shoulder on this candidate H&S, or a retest of the highs to form the second high on a double-top:
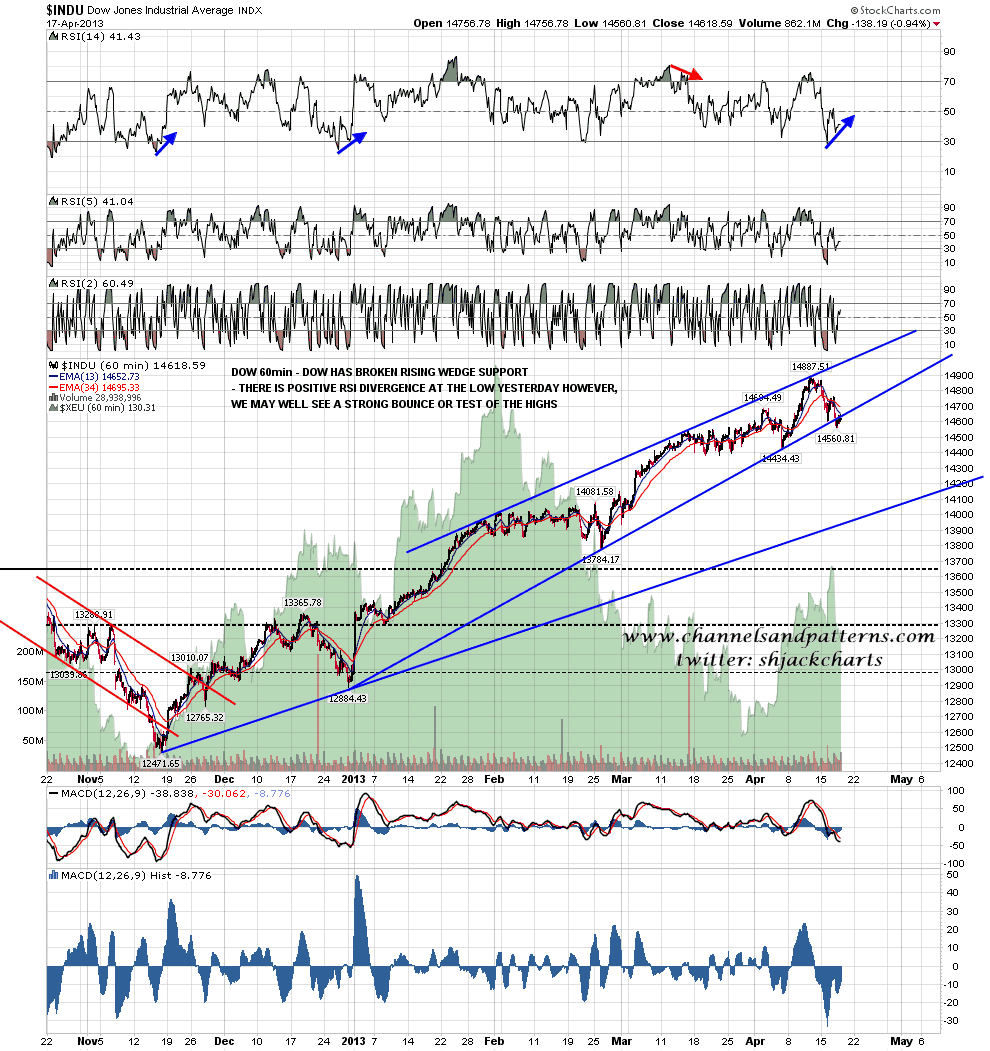
Scanning through other main equity indices Dow broke rising wedge support yesterday and was also showing positive RSI divergence at yesterday’s low. The obvious target there is a retest of the highs:
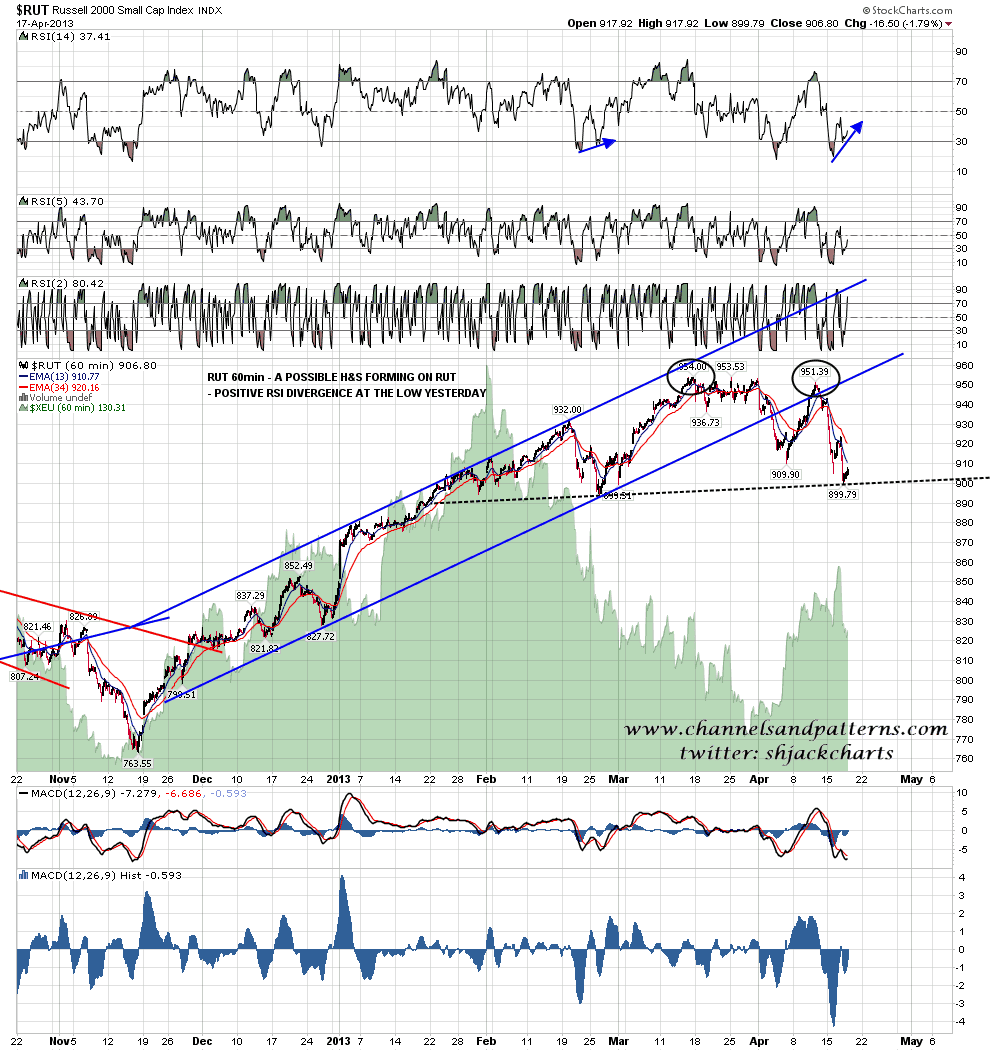
RUT also made a low yesterday that completed the head on a candidate H&S pattern. Again there was positive RSI divergence at the low yesterday:
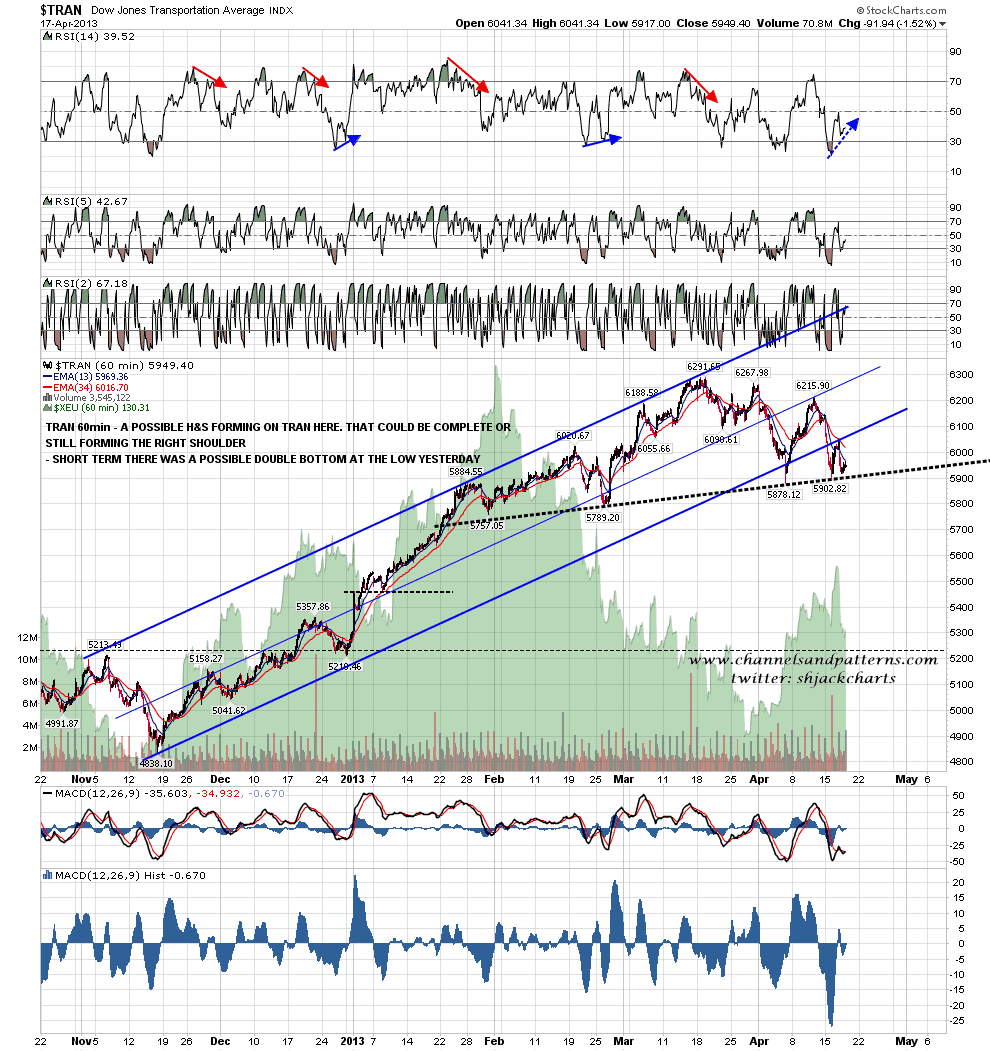
Looking at TRAN, which like RUT peaked a month ago, there is another possible completion of the head on an H&S there, though there is an argument that pattern has already finished forming. No positive RSI divergence there at the low yesterday but there is a possible short term double-bottom:
The SPX daily chart is also supporting a bounce here, with the daily lower bollinger band almost hit yesterday and a test of support at the 50 DMA at the low. This is a natural level for a bounce:
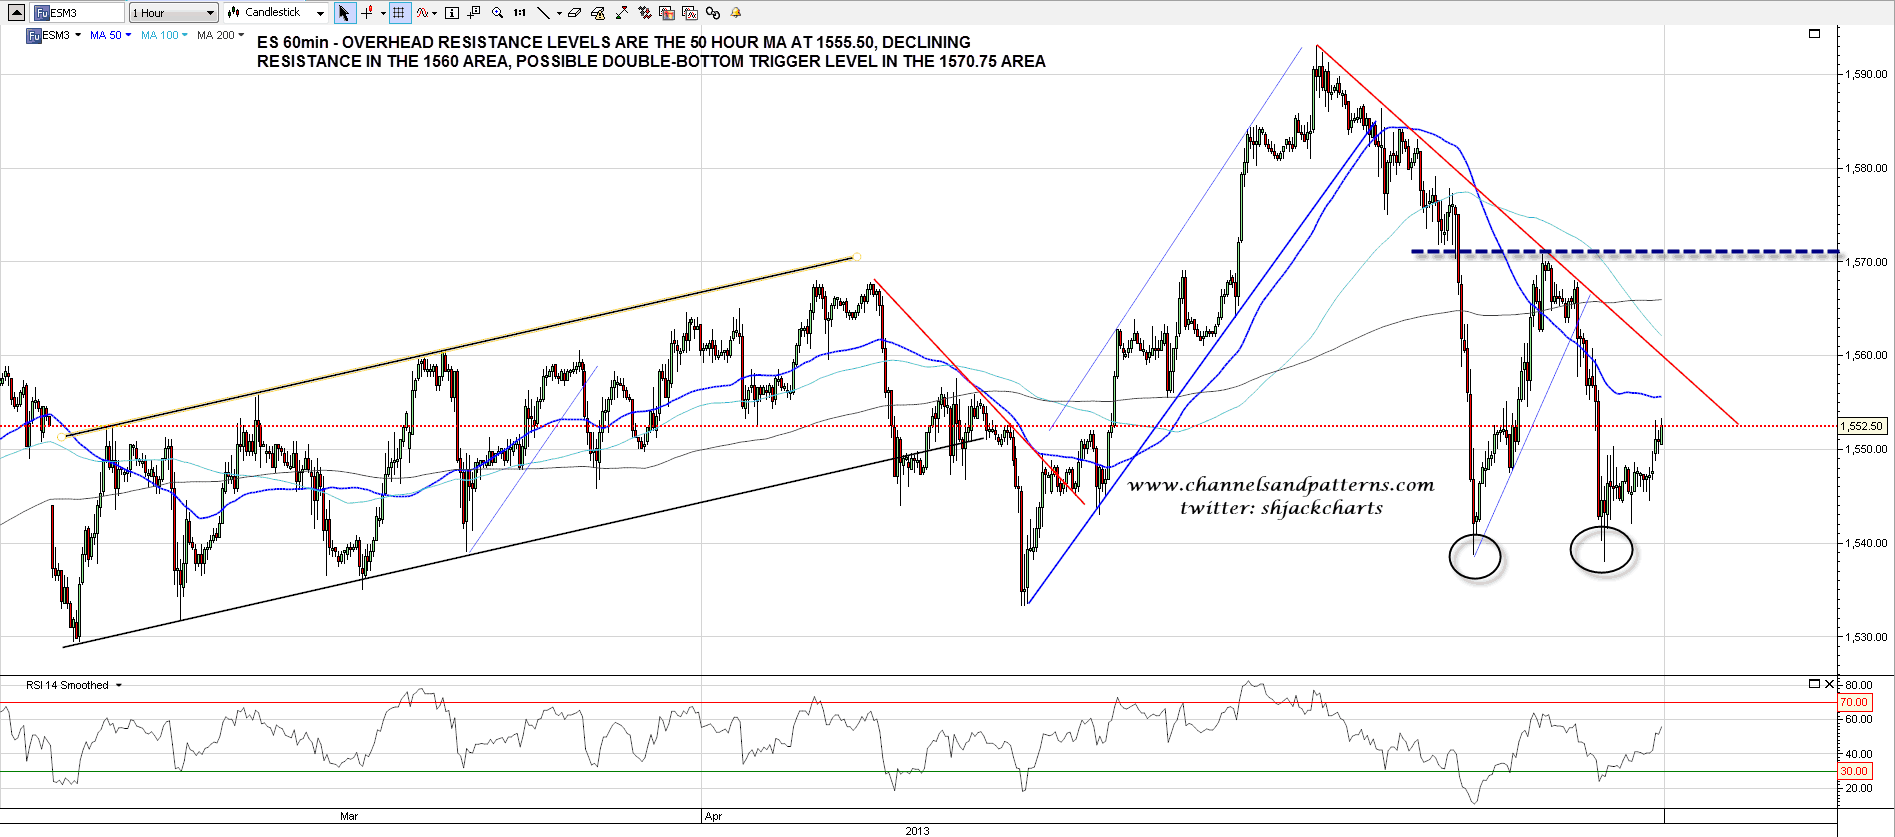
ES looked as though it might be forming a bear flag for some of the night but has now broken up from there with some confidence. The main overhead resistance levels are the 50 hour MA at 1555.50, strong declining resistance in the 1560 area, and the possible double-bottom trigger level in the 1570.75 area. I’m not giving this candidate double-bottom much weight as in my view it is oversized relative to the decline leading into it:
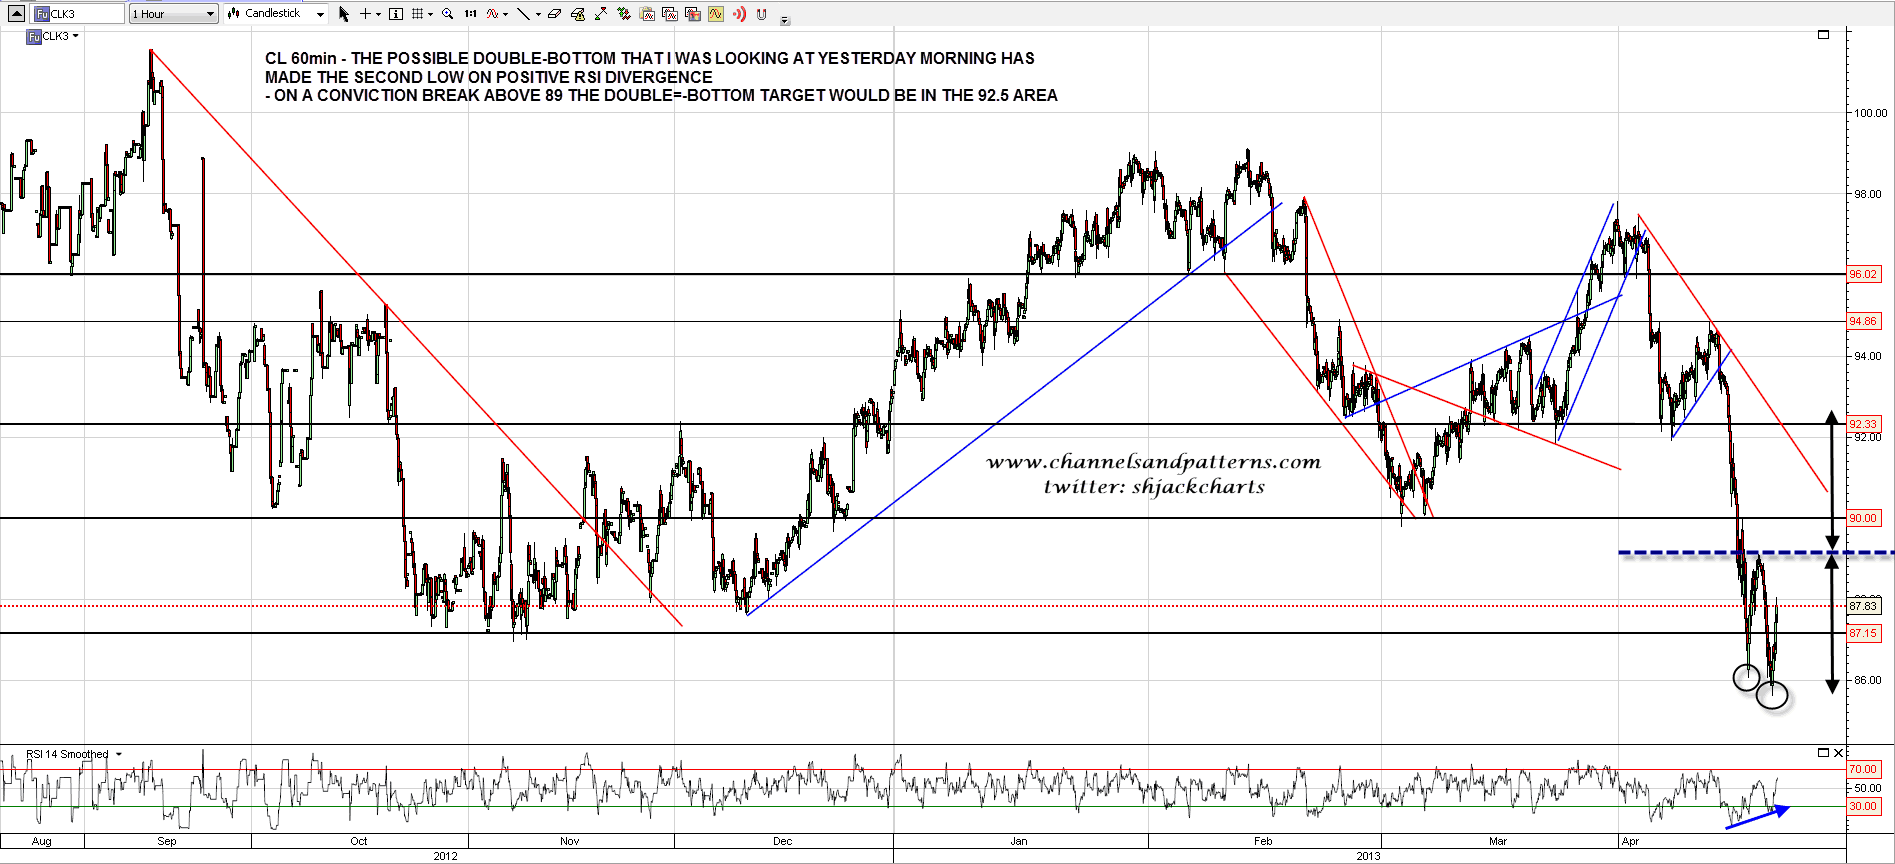
The possible double bottom setup that I was considering yesterday morning on CL has now made the second bottom and bounced strongly. The target would be the 92.5 area on a conviction break over 89:
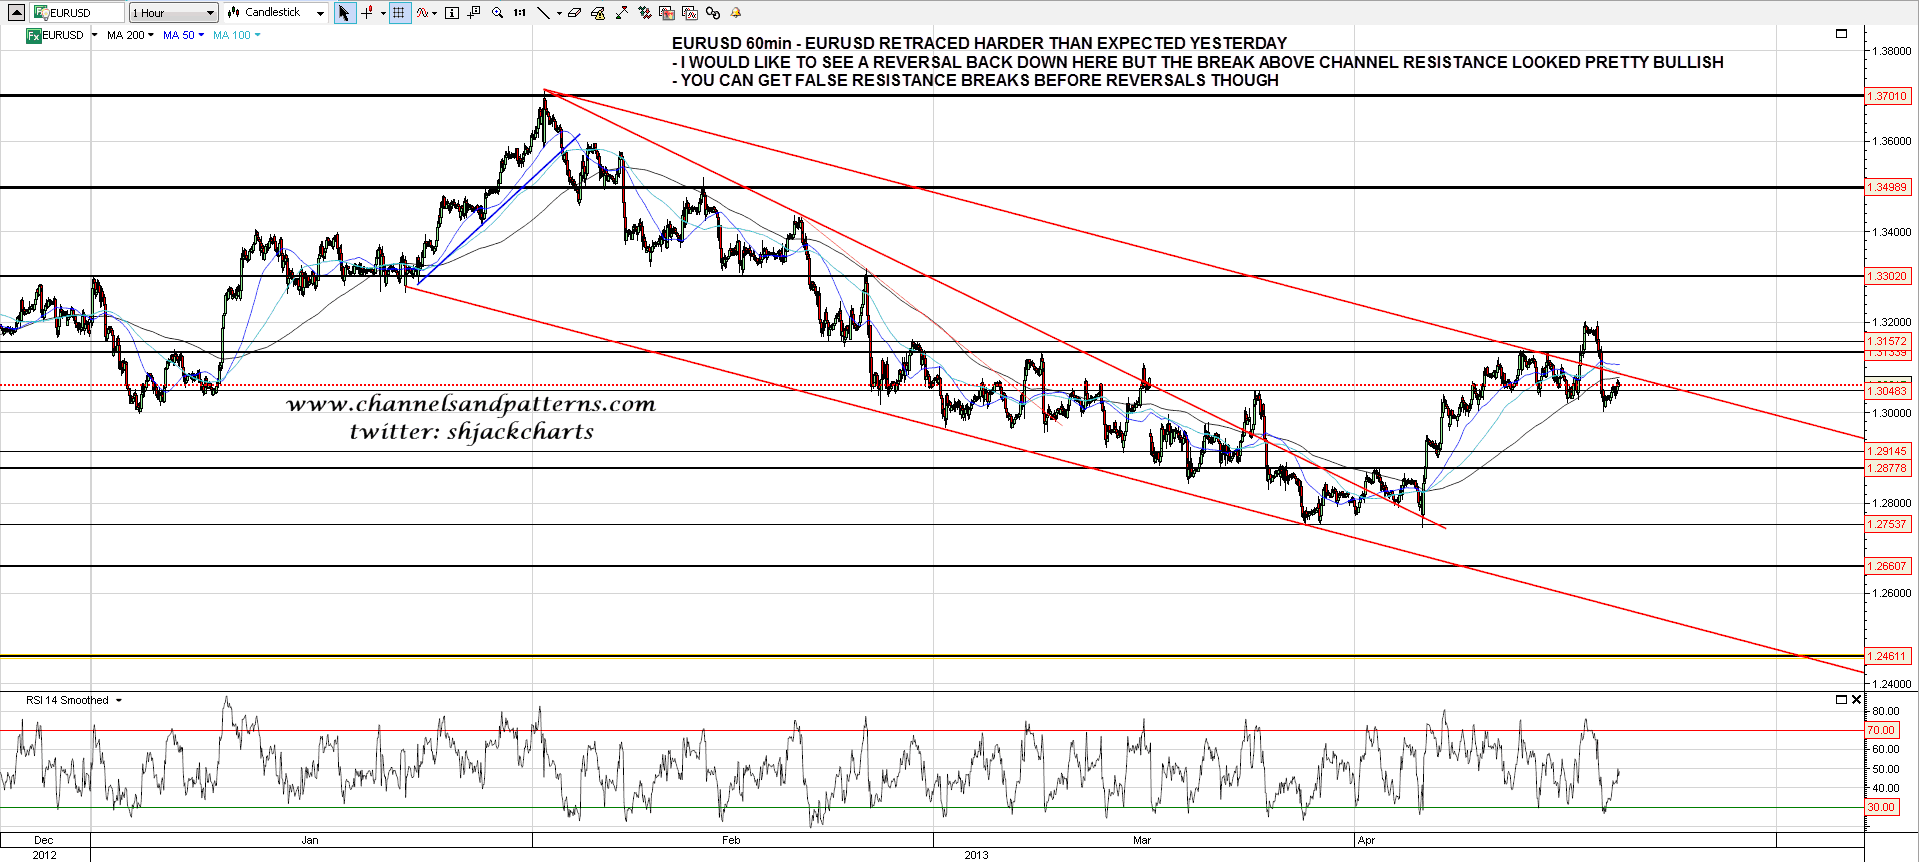
EURUSD retraced a little further than I was expecting yesterday and it’s just possible that the channel break this week was a false break up. that generally wouldn’t be the case but I’m watching with interest as it seems absurd that EURUSD should rally strongly here, even against the rapidly diluting USD. It is very important however for TA to be led by price action, bad things happen when analysts decide first what will happen and then look for evidence to support the conclusion that they have started with. If this is a genuine break up on EURUSD that needs to be respected:
Obviously I’m leaning strongly towards a bounce from the lows yesterday, particularly as this sort of positive RSI divergence at the lows yesterday has been a very good performer over the last few months across multiple indices, and the likely targets for that bounce on SPX are at the 1574 area for the H&S scenario, and at a retest of the current highs for the double-top scenario. I think that we will see one or the other. For today key resistance is on ES at declining resistance in the 1560 area.
