
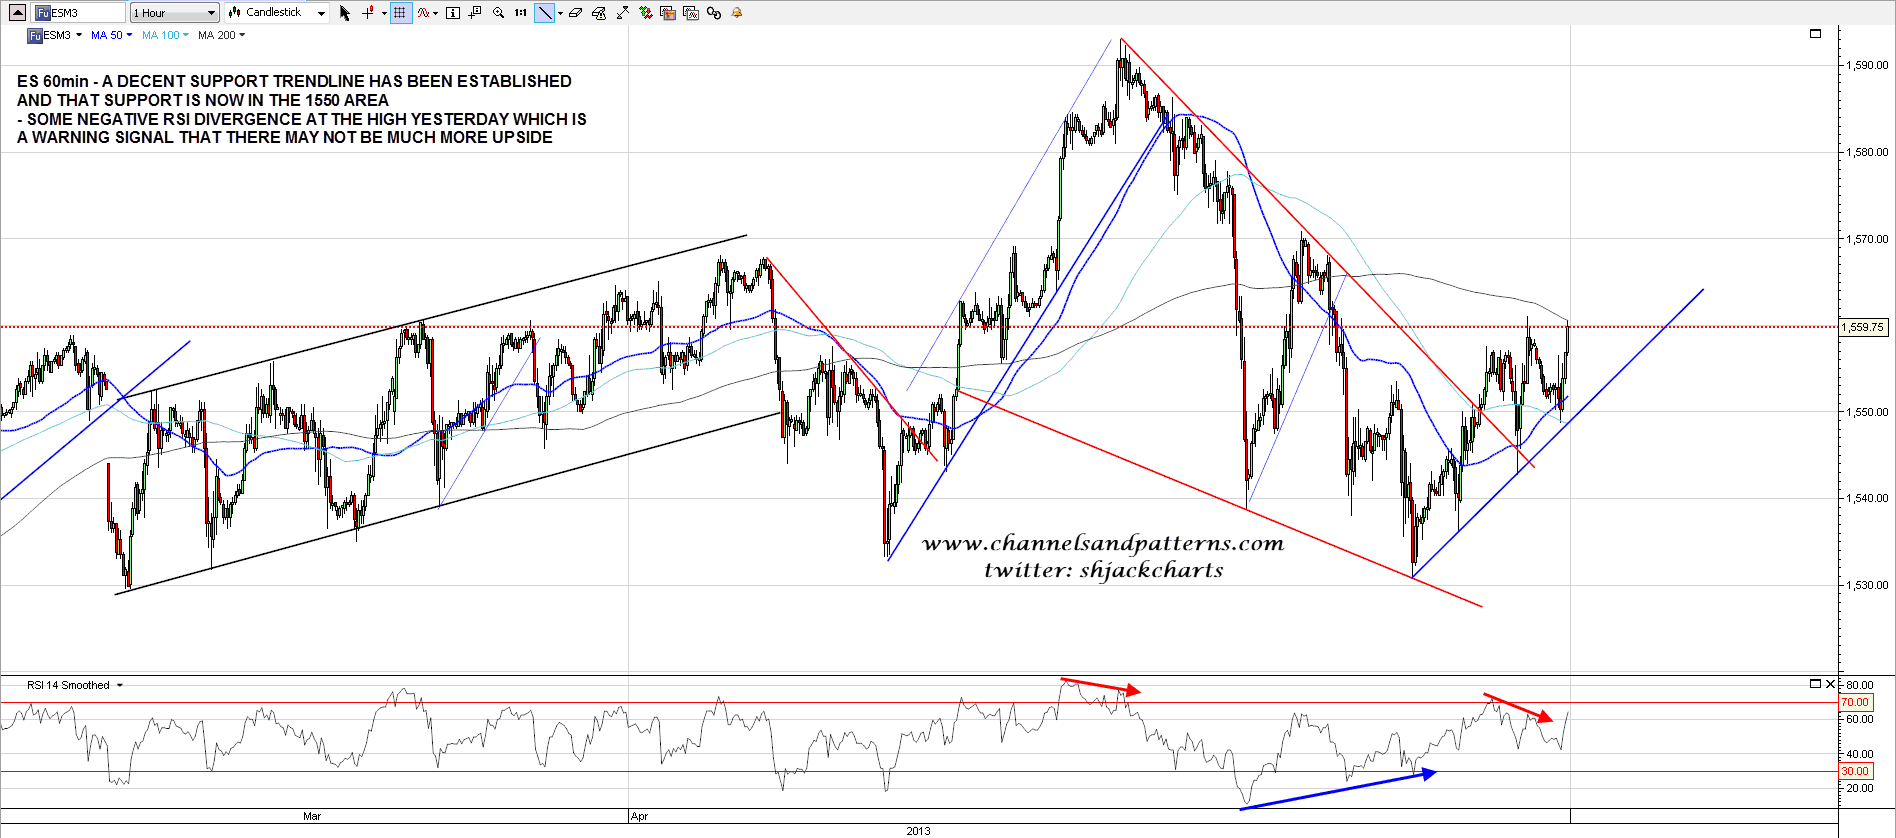
ES made decent progress yesterday and has established a decent rising support trendline. There was some negative RSI divergence at the high yesterday but after some retracement that high has now been broken with some confidence. The next decent resistance is in the 1570/1 area:
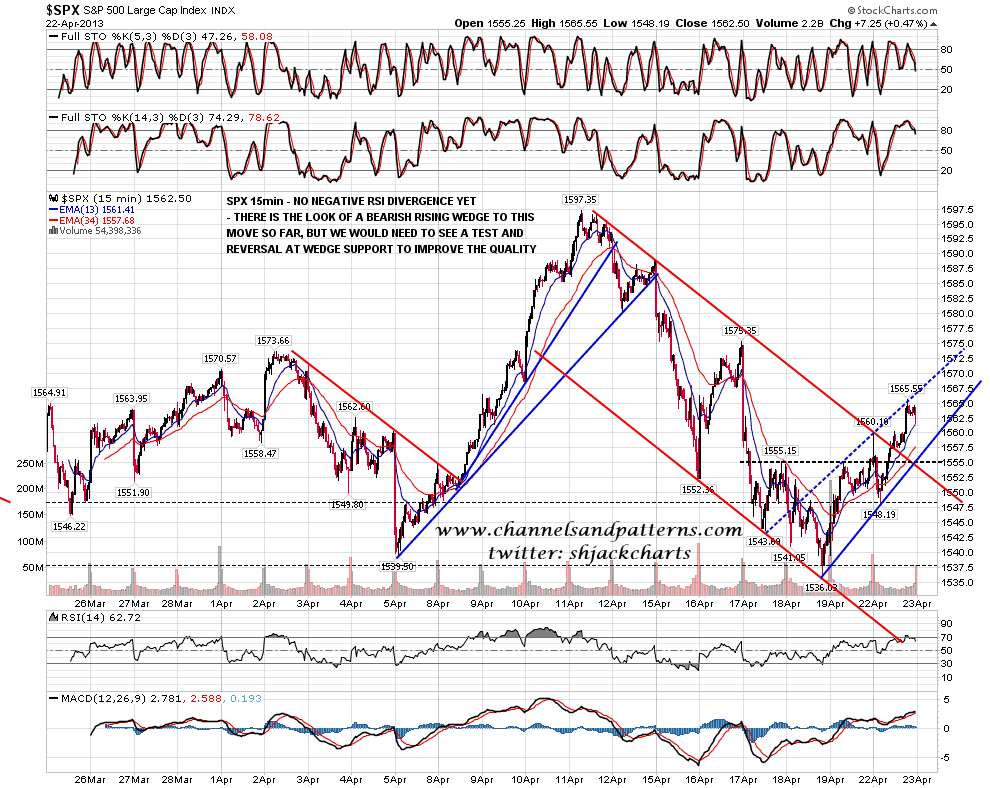
There is the look of a rising wedge to the current move on the SPX 15min chart, and that would look stronger if we were to see a test and reversal back up off wedge support in the 1555-8 area today. The IHS target is in the 1574 area:
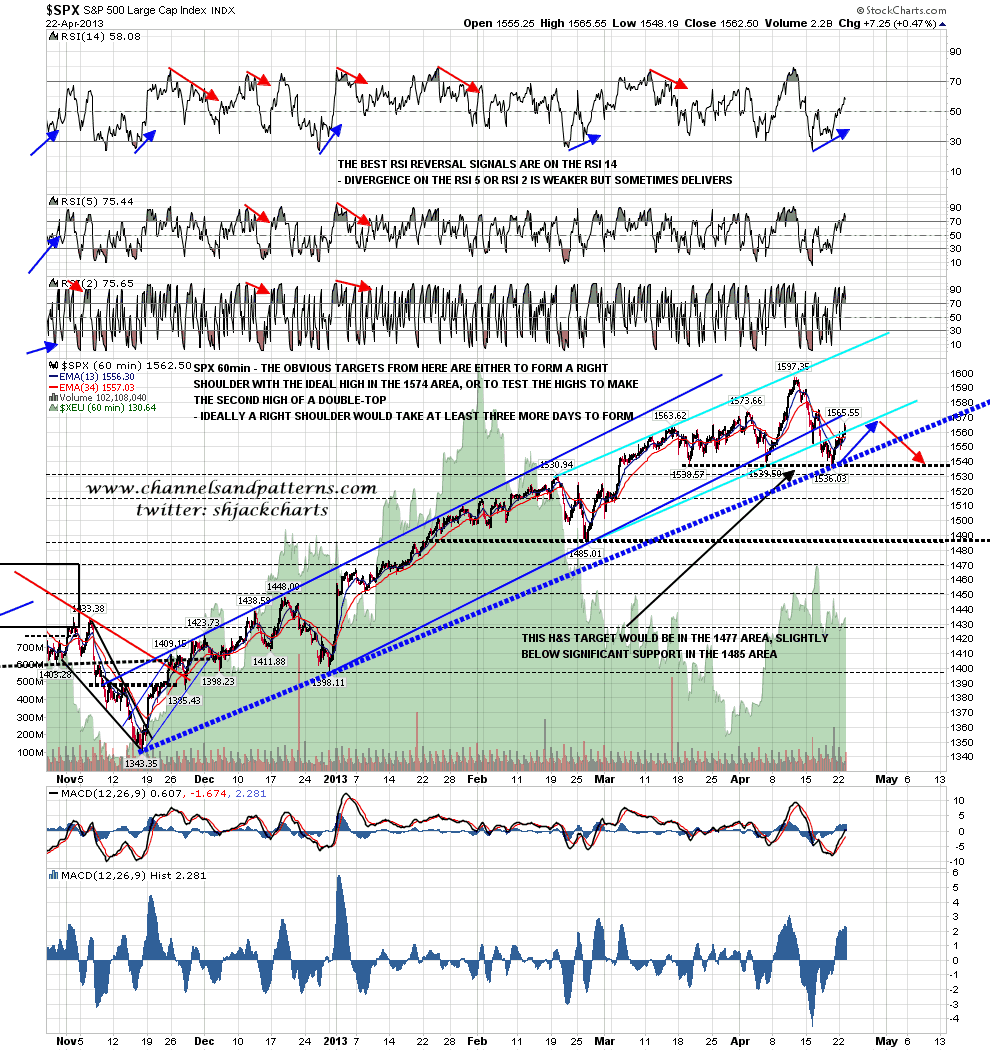
On the 60min chart, as I have said before, the obvious targets for this move are either to make a right shoulder high of an H&S in the 1574 area, or the second high of a double-top at a retest of the highs. If we are seeing a right shoulder form I would expect that to most likely take another two or three days at least for symmetry:
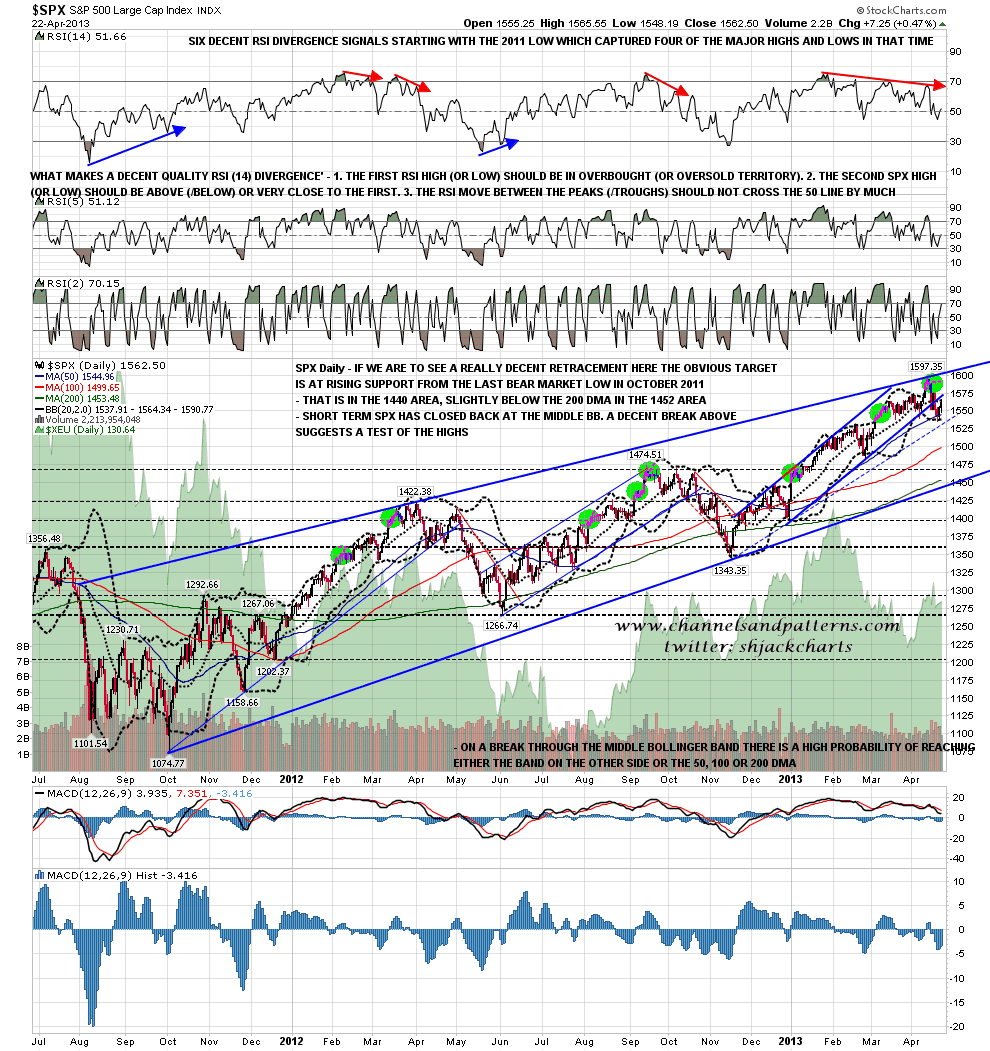
The close yesterday on the SPX daily chart was back at the daily middle bollinger band. A daily close back well above this would suggest a test of the upper bollinger band, now in the 1590 area:
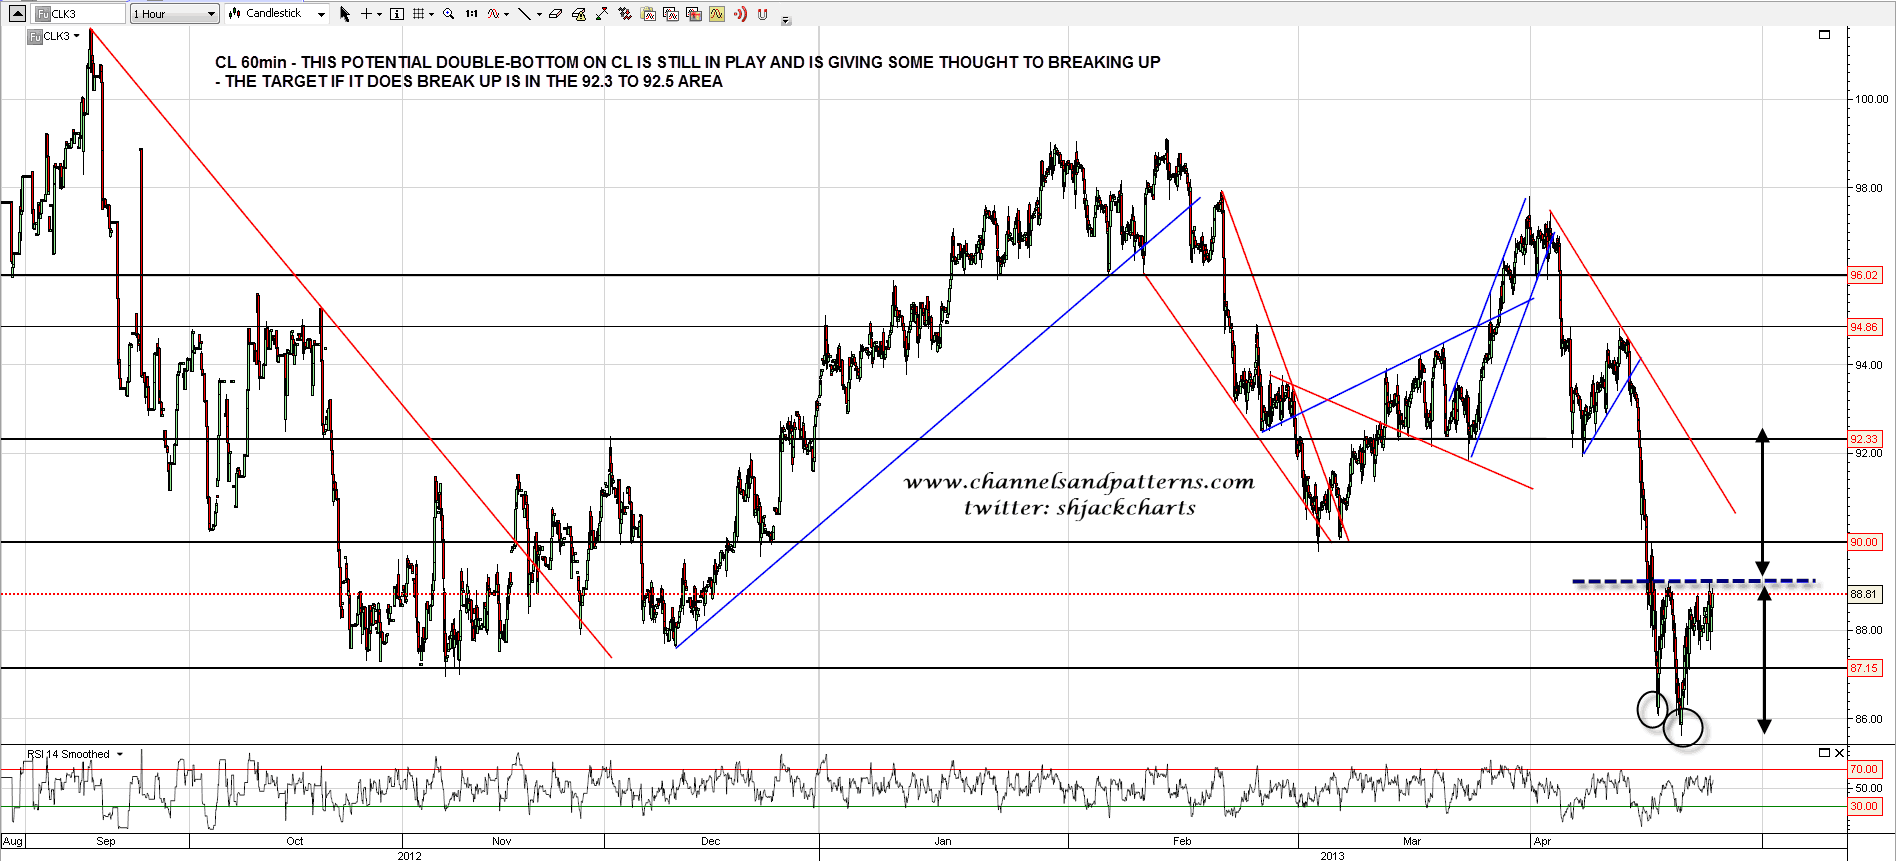
CL has been testing the trigger level on the possible double-bottom there. A decent break above has a target in the 92.3 to 92.5 area:
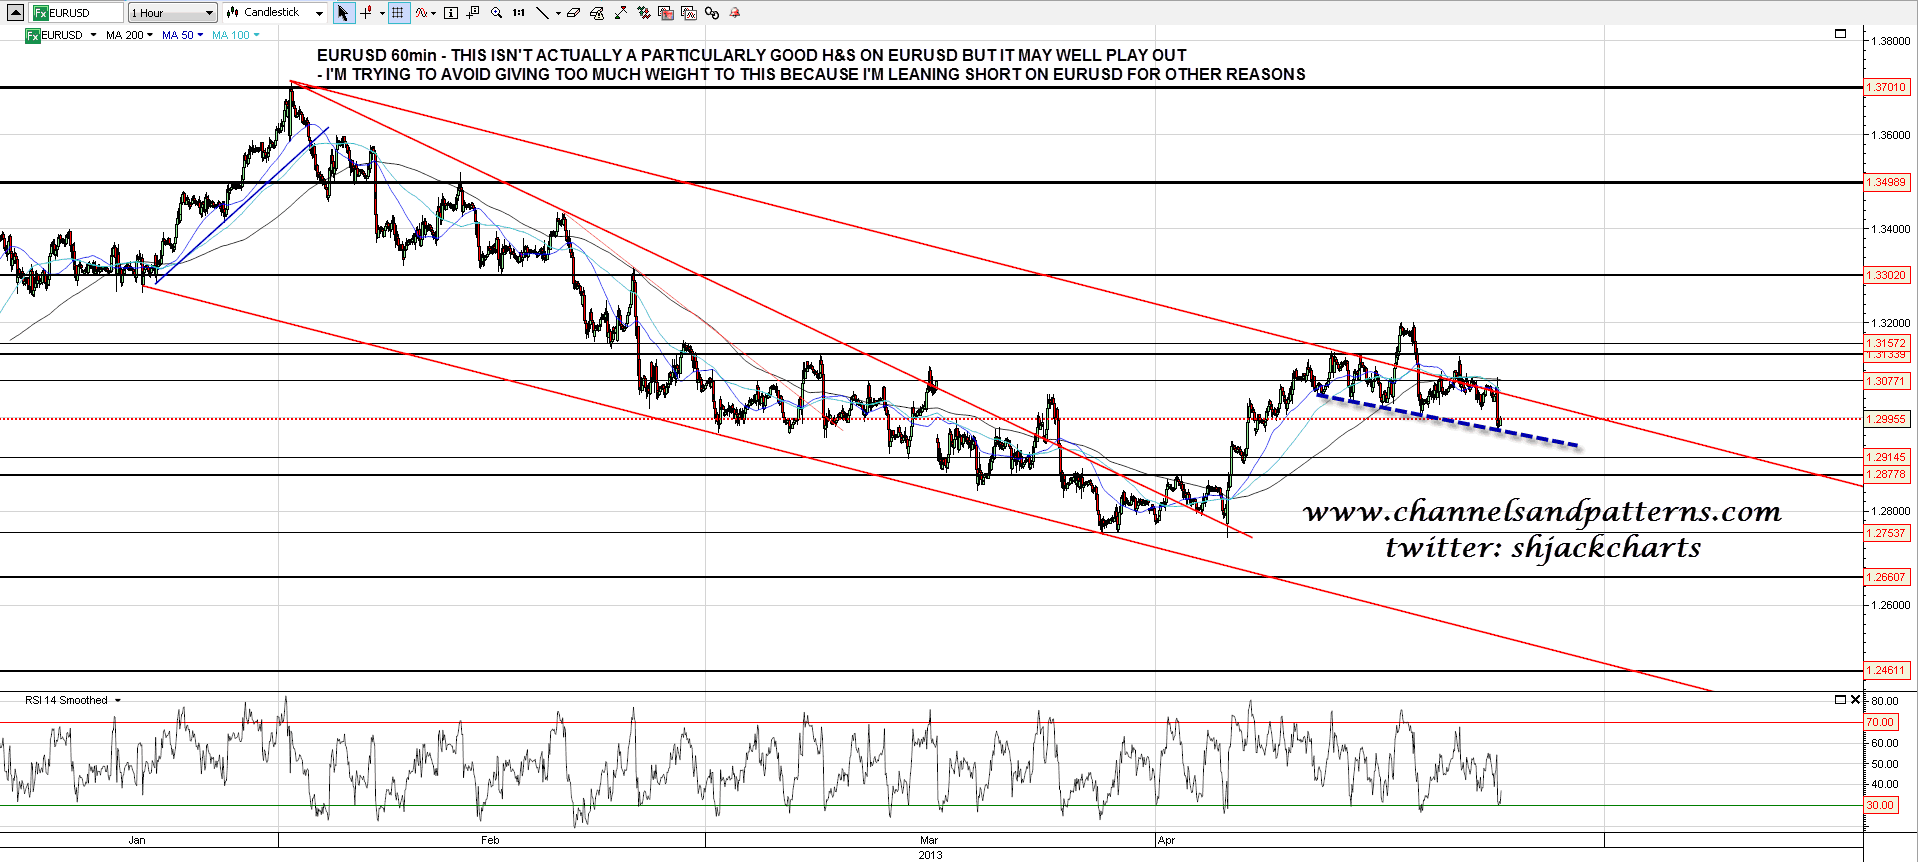
On EURUSD the possible H&S I pointed out yesterday is now fully formed and targeting the current lows on a break down. This isn’t a great quality pattern though and I’m concerned that I may be projecting my strong expectation that EURUSD should fall here onto the chart:
As I’ve mentioned before I think we are in final weeks of a topping process for the usual spring high, and am looking for either an H&S or double-top to form here as the reversal pattern we would normally expect to see here for that. Is that guaranteed? No, but the odds are good in my view. I’ll be doing an analysis of the key support levels on the way back down for tomorrow’s post.
