
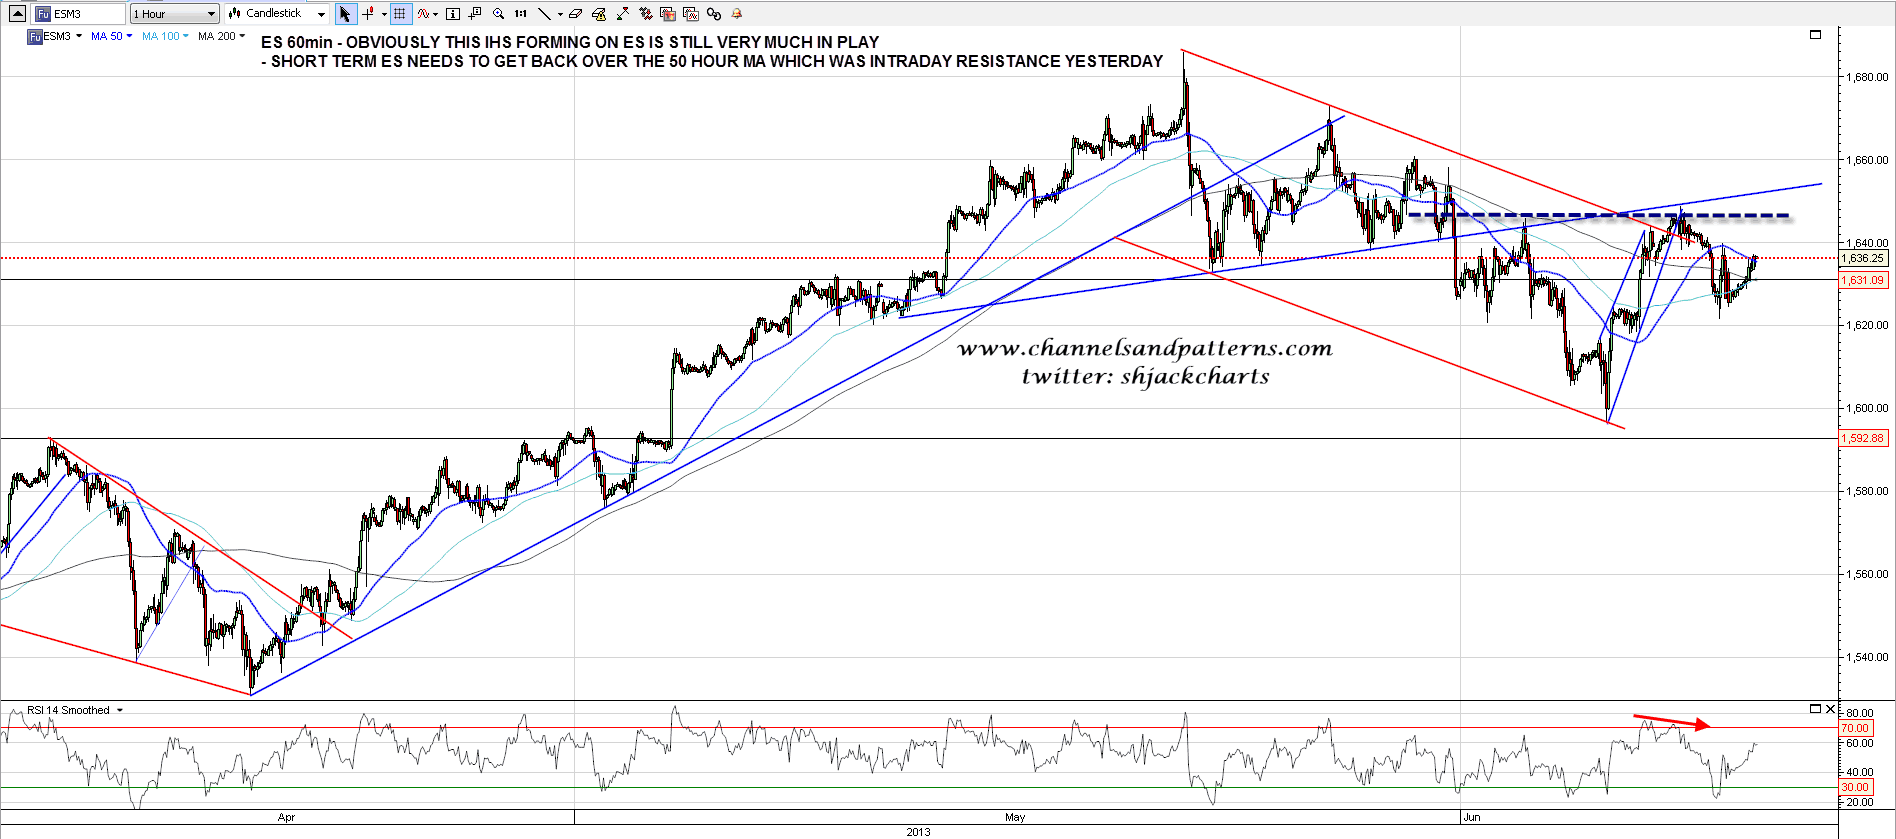
I want to have a good look at bonds today but first I’ll look at the IHS patterns that we’ve been watching develop since I posted the first chart looking at this possibility on SPX last Friday. On ES the IHS is forming nicely, with the next obvious step being to recover over the 50 hour MA, which was intraday resistance yesterday. The IHS shoulders look balanced so for good symmetry this IHS should ideally break up today, and no later than tomorrow. ES 60min chart:
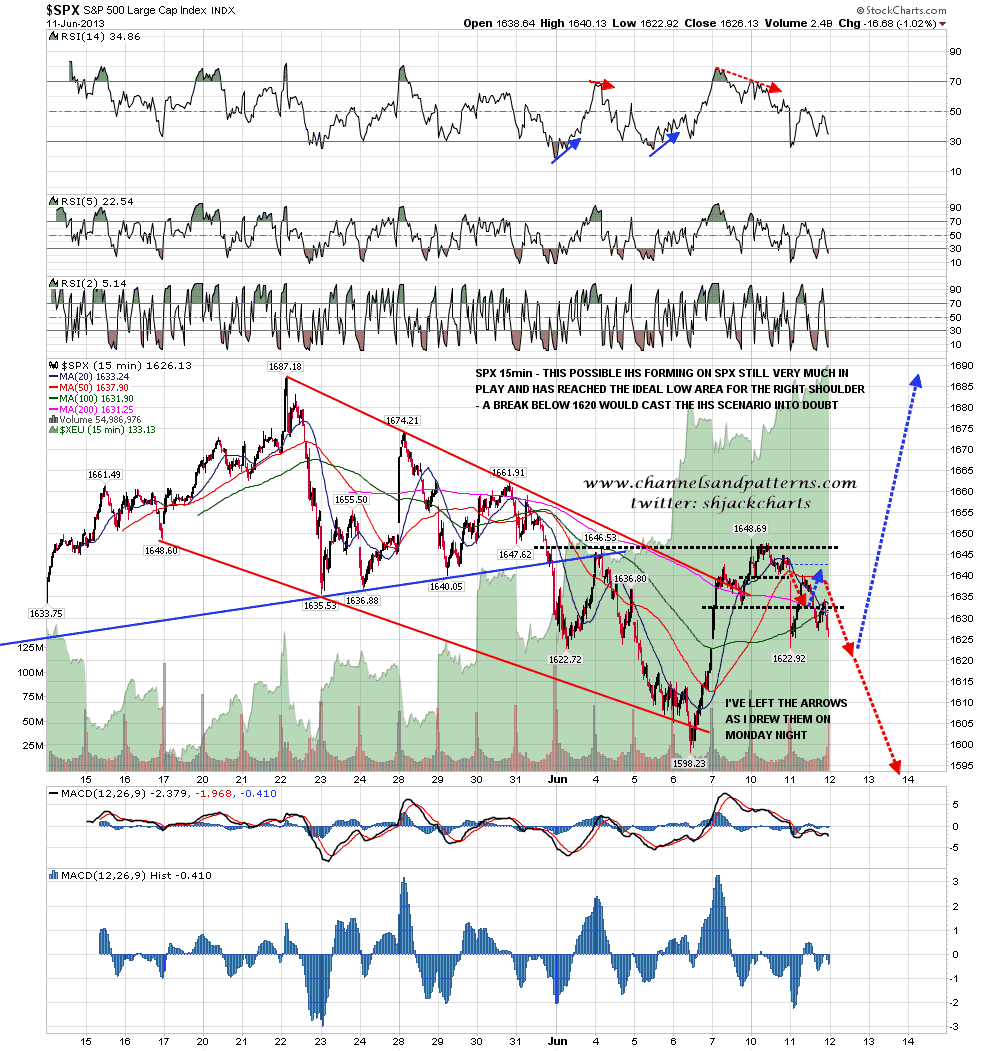
I posted the SPX 15min IHS on twitter last night and here it is again. As with ES, the shoulders are well balanced and this IHS is ready to break up soon if it’s going to break up at all. SPX 15min chart:
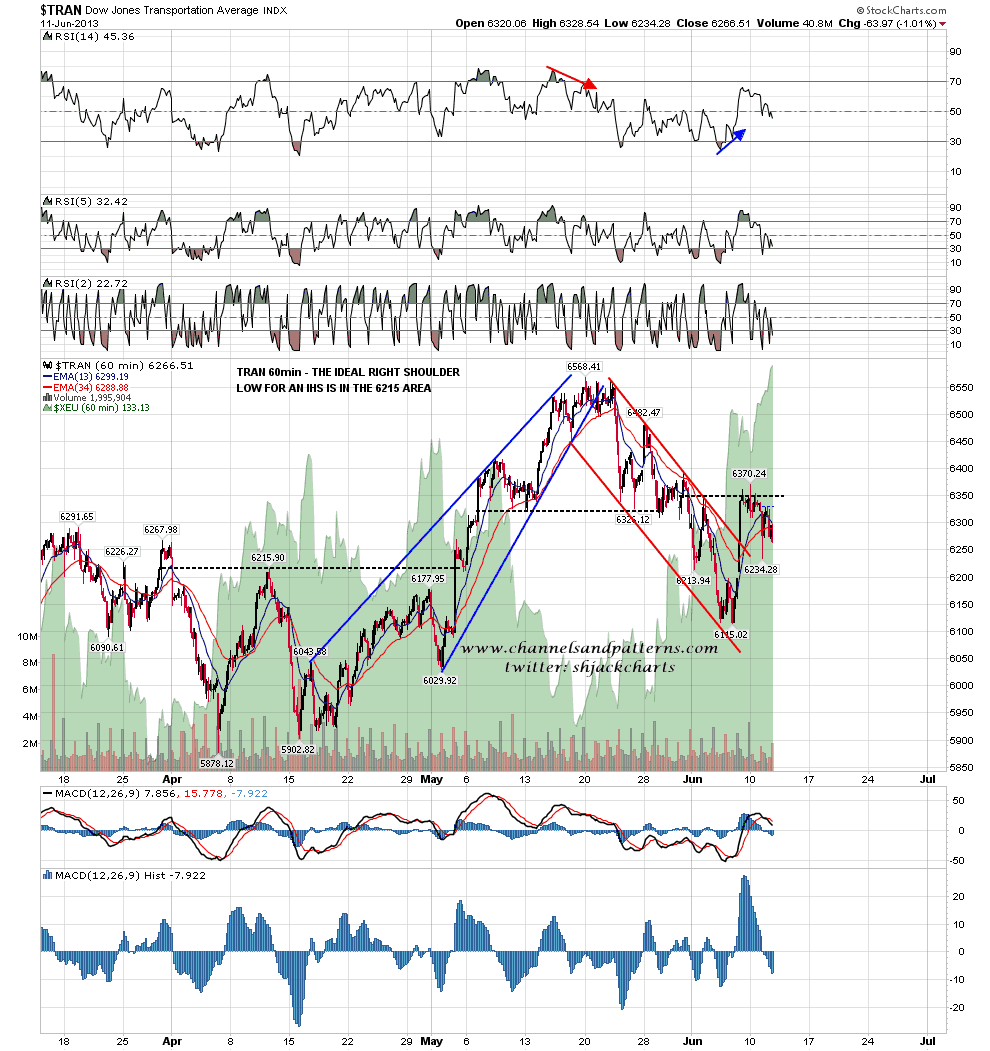
The IHS on the TRAN 60min chart has also been forming a decent right shoulder. TRAN 60min chart:
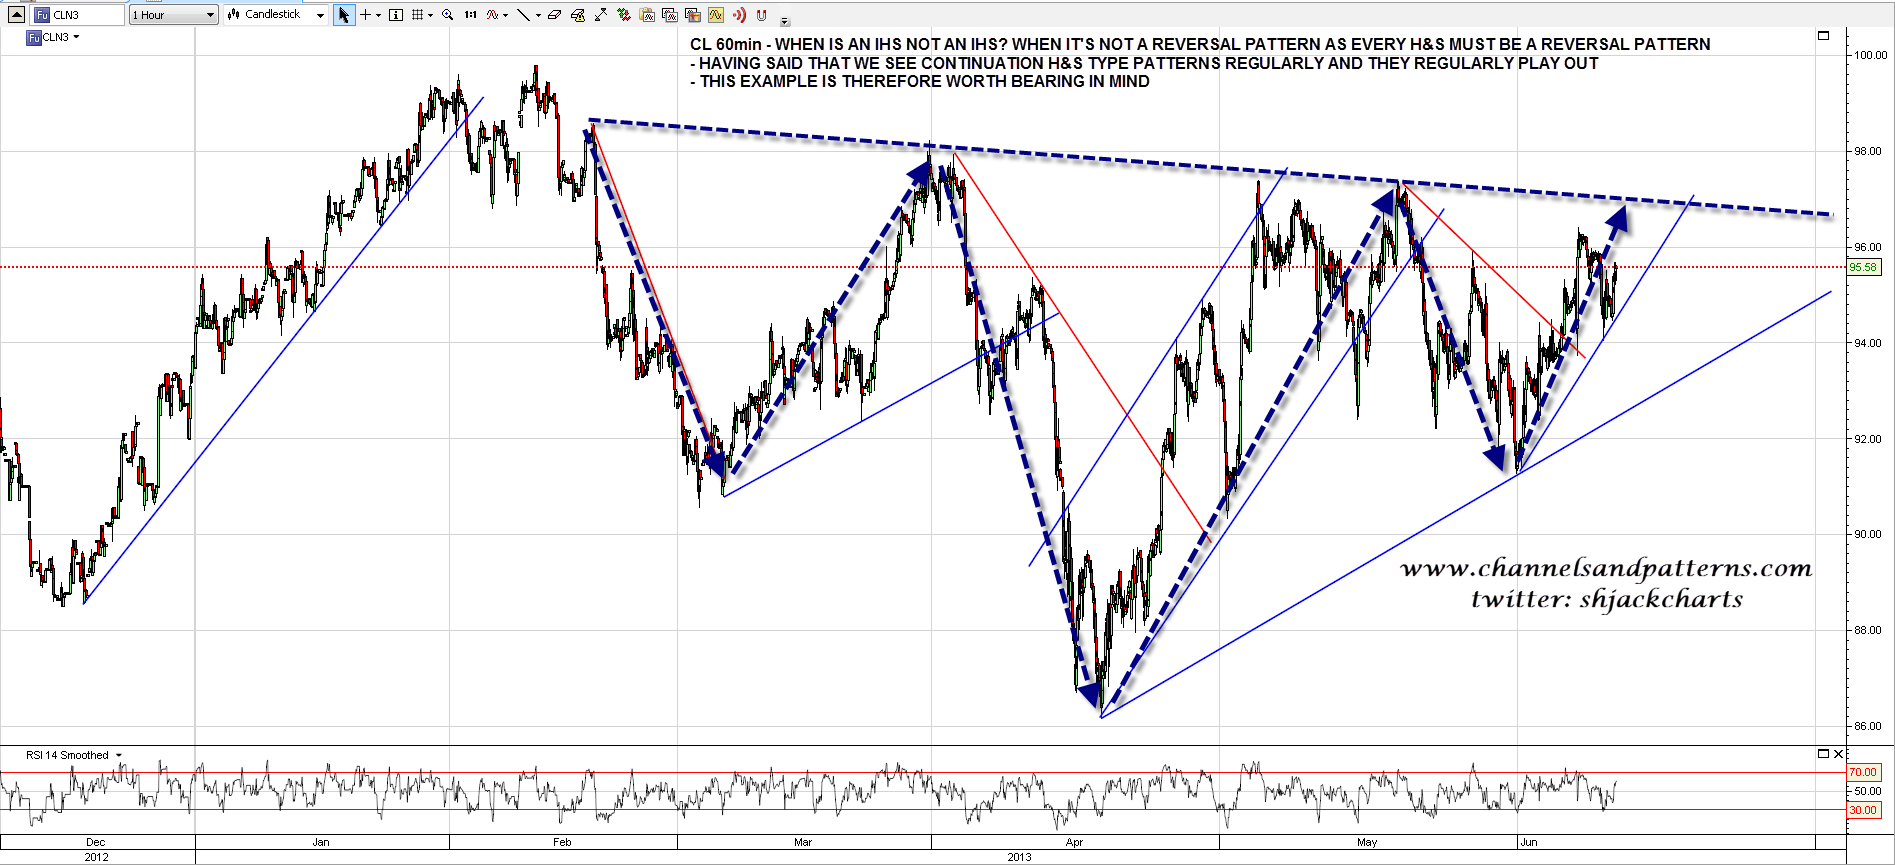
On other markets DX has been weak overnight but looks as though it may reverse back up very soon. CL reversed back up somewhat below the break yesterday and I have marked in a new rising support trendline accordingly. Someone is going to mention the IHS type pattern on CL soon so I will mention that myself now and make my usual observation that this is not a true IHS, as every H&S pattern must be a reversal pattern, and this one isn’t. Have I seen these form and play out to ‘target’ regularly? Yes, though I’ve also seen them fail more often than their legitimate cousins. Something to bear in mind. CL 60min chart:
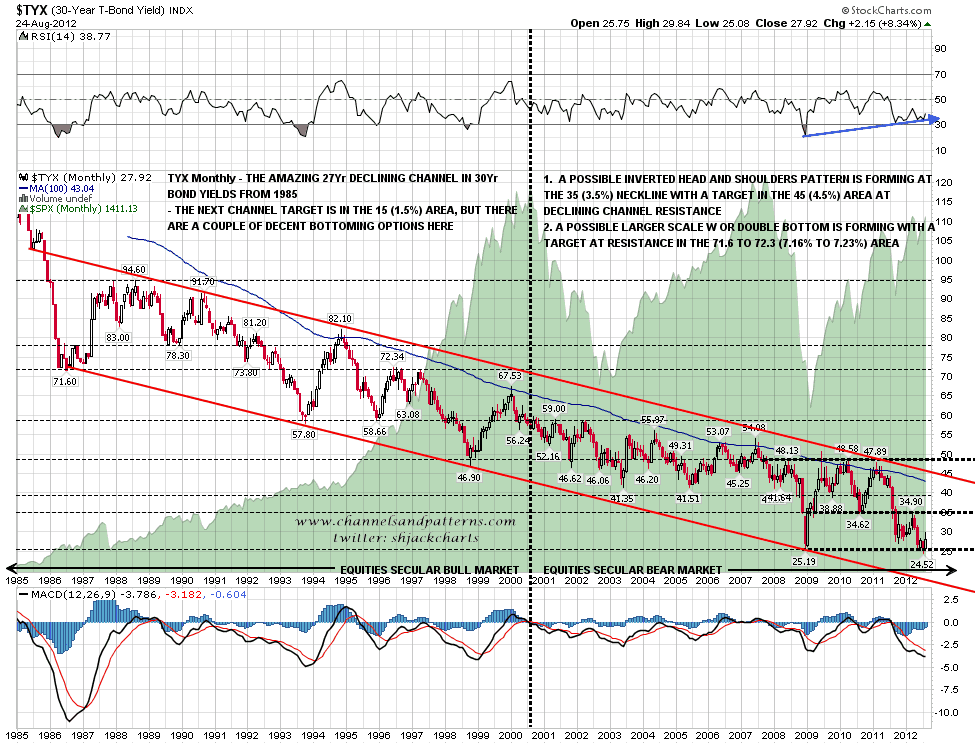
On to bonds. On 25th August last year I posted a TYX chart showing bottoming options for 30yr Treasury Yields. I was forecasting a rise in 30yr Yields to the 3.5% area as the head formed on a possible IHS that was part of a much larger double-bottom to break the (now) 28 year old declining channel on 30yr Treasury Yields. Here is that chart I posted then. TYX monthly chart (from 120825):
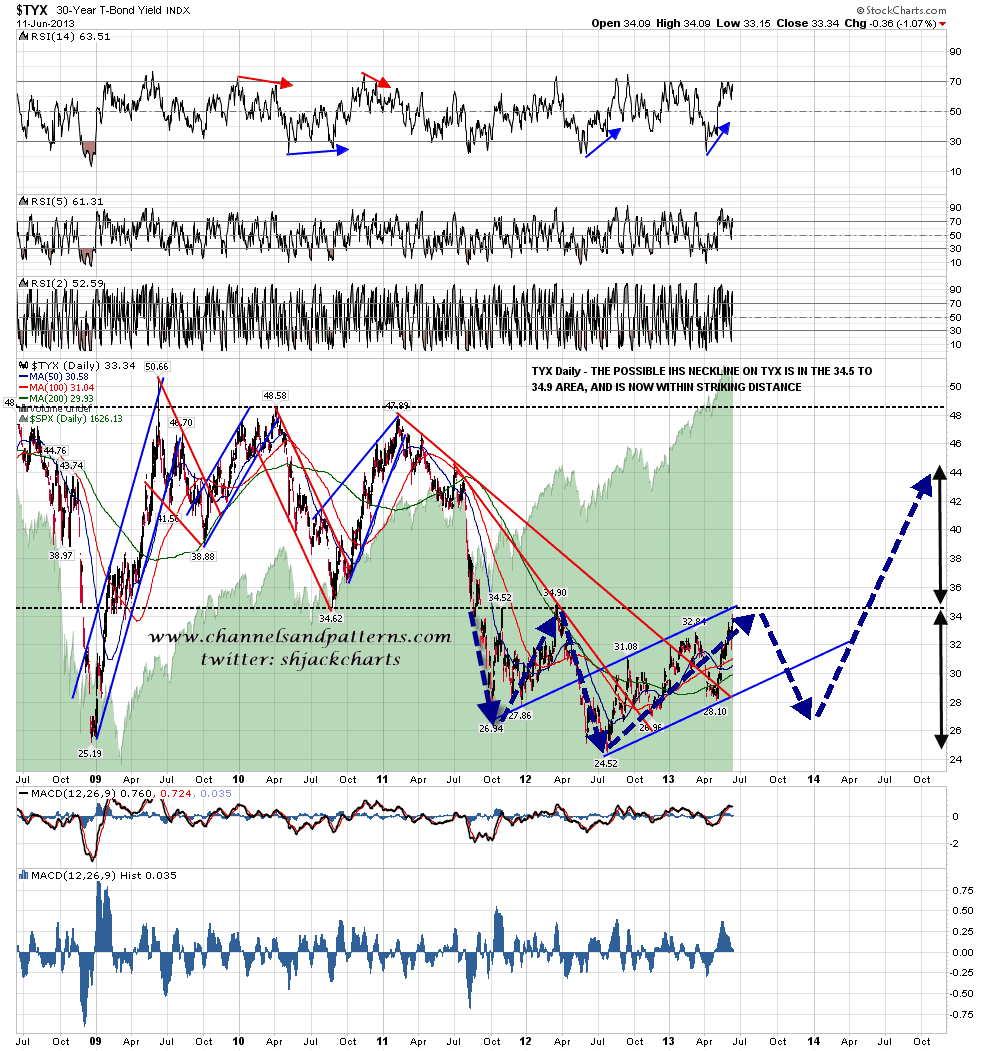
It takes a while for much of interest to happen on these long term bonds charts, so almost a year later TYX has traded over 34 (3.4%) yesterday and is now within striking distance of the IHS neckline that I was looking at then. There is therefore a significant possibility that, just as everyone is now writing off USTs as a lost cause, we may well see a major UST rally into the end of the year and perhaps beyond to form the right shoulder on this possible IHS. TYX daily chart:
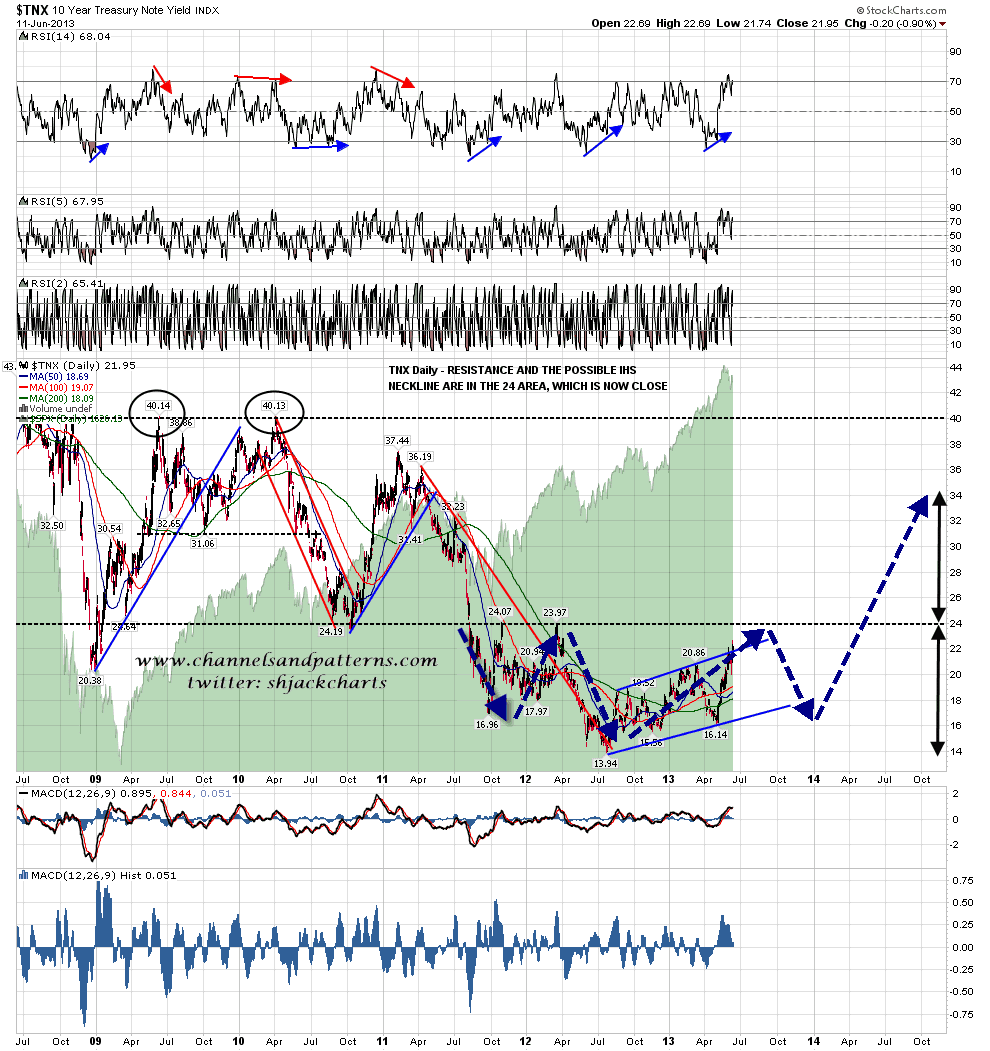
There is a similar setup on the TNX chart (10yr Treasury Yields), though TNX is further away from the possible IHS neckline. TNX daily chart:
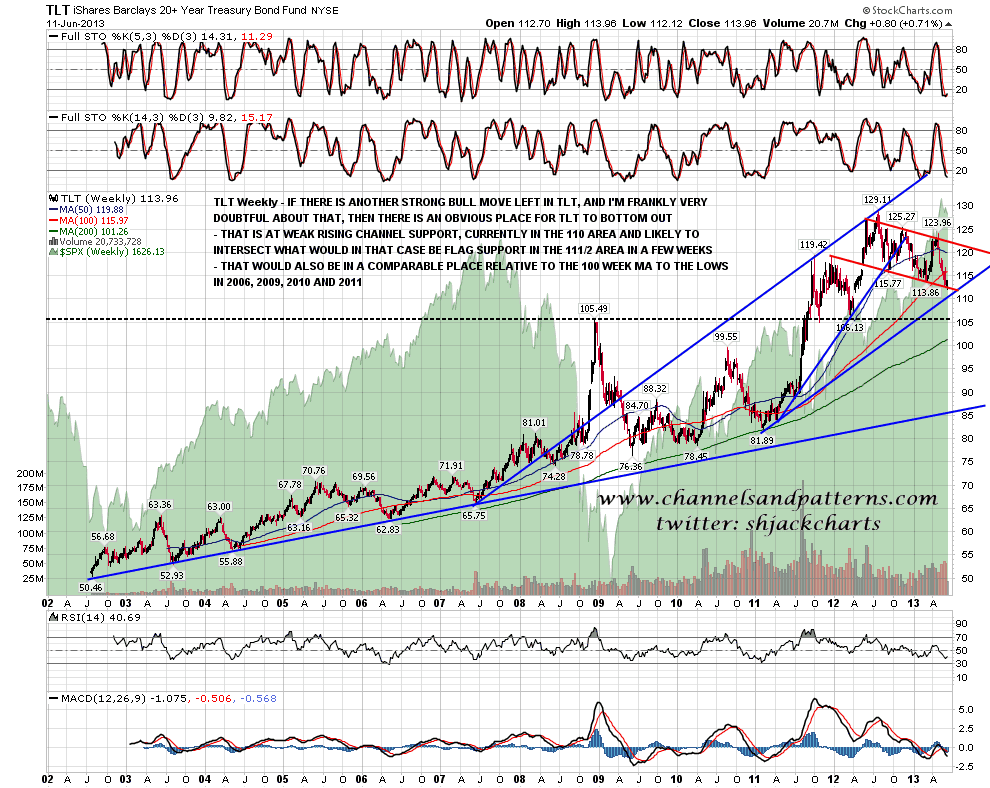
I’ve been forecasting a similar (mirror image) H&S to form on TLT, but actually corporate bonds have been considerably outperforming USTs, which I hadn’t considered, so it may well be that if USTs reverse at the IHS necklines, then TLT will also reverse without reaching the obvious neckline there. That brings me back to the alternate bullish scenario I put together on TLT a few days ago. This scenario comes apart if TLT trades below 110, but until then I have a candidate rising channel and a scenario that could deliver the second high of a double-top on TLT for a nice technical finish to TLT’s bull market since 2009. Something to bear in mind. TLT daily chart:
Will these IHS patterns on SPX/ES and TRAN play out? The next step is for ES to recover over the 50 hour MA, now at 1635.50, which will improve the odds considerably. After that there should be a fairly clear run to trendline resistance in the 1650-2 area, and on a break with confidence above there, the next big resistance is the daily upper bollinger band in the 1675 area. A failure to recover over the 50 hour MA would look bearish, a significant break below yesterday’s 1621.50 low at this stage would put the IHS in serious doubt, and on a break below 1615 ES I would be inclined to write off this IHS scenario.
