
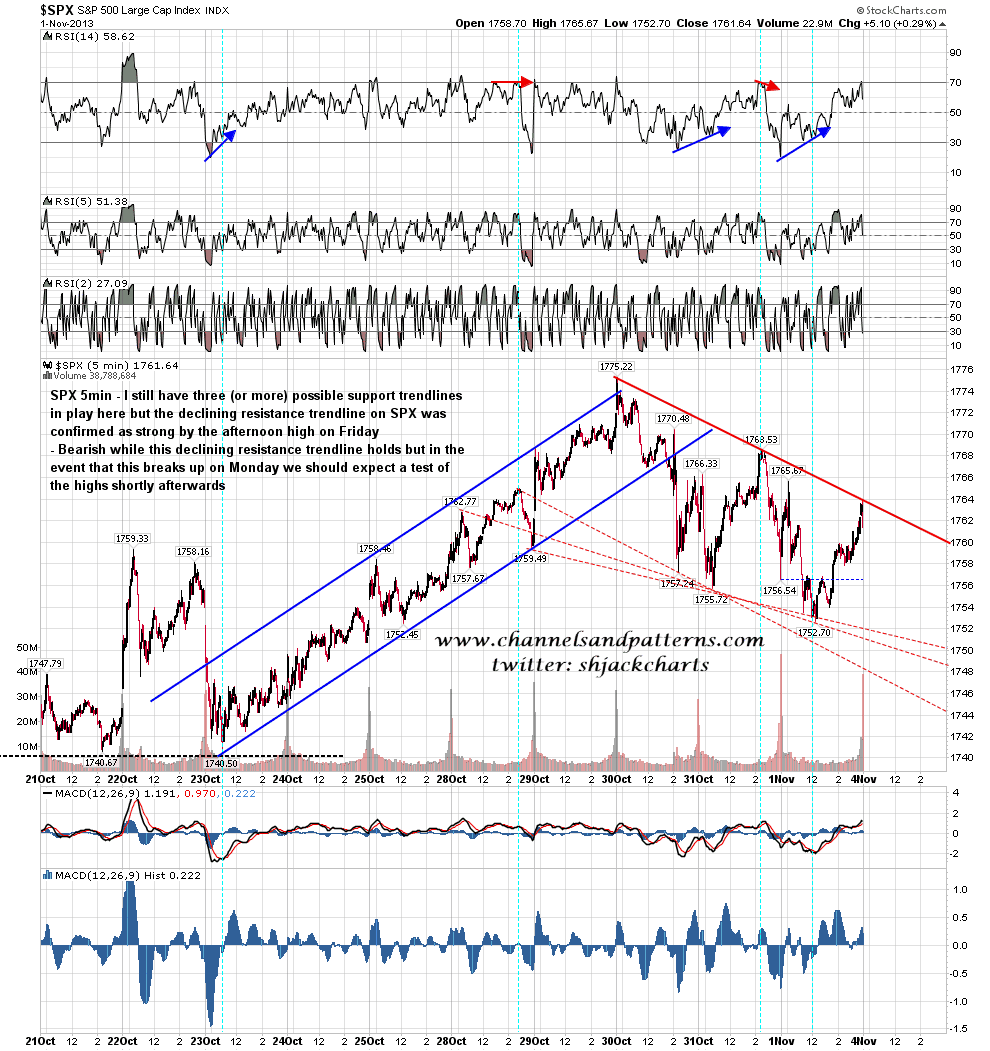
I was mentioning the possibility repeatedly last week that ES / SPX might return to retest the highs and there is now a clear dividing line to determine whether that is likely. That is declining resistance from the high on SPX which was confirmed with a third touch at the afternoon high on Friday. I posted the SPX 5min chart showing that on twitter yesterday and here is that chart again. SPX 5min chart:
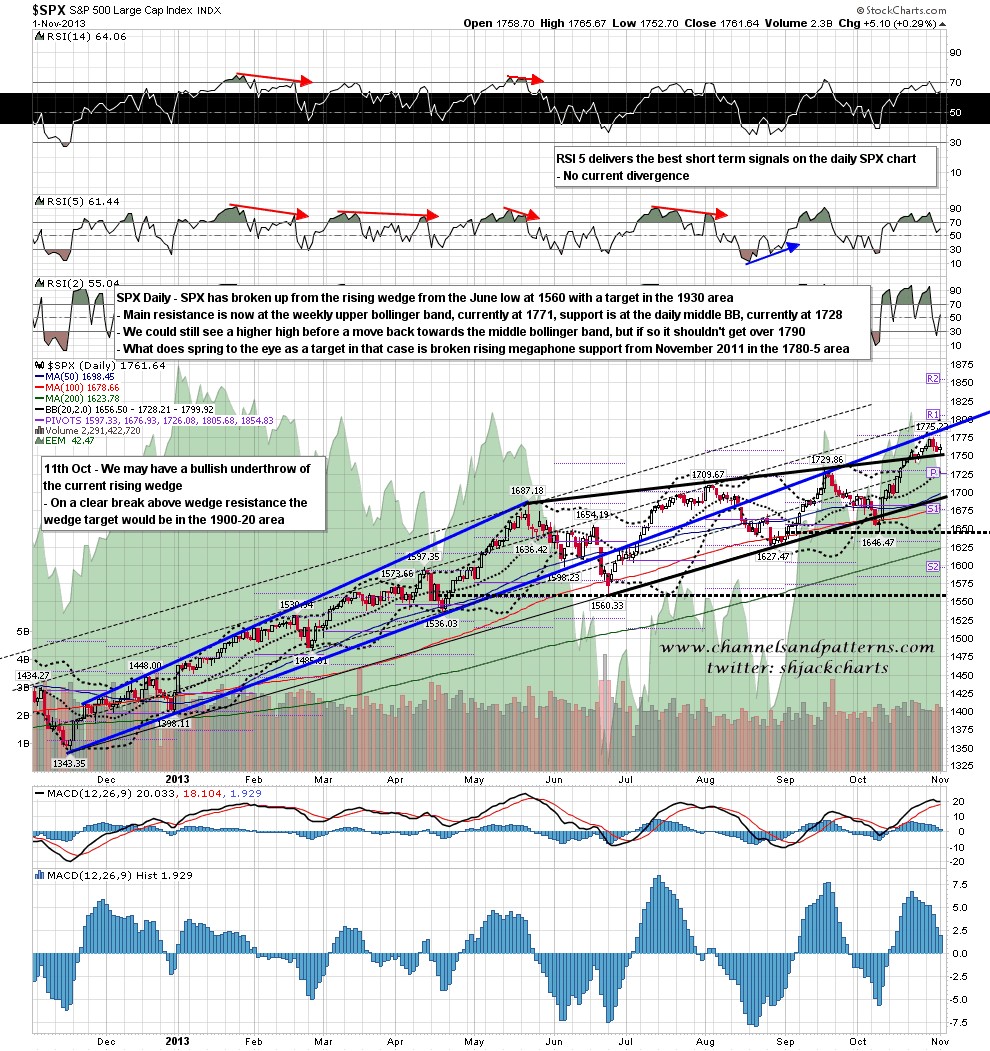
If we do see a break up this morning then upside is still limited by the SPX weekly upper bollinger band, which closed at 1770 on Friday and given a strong week might close as high as 1780-5 this week,. That does leave within that range a possible retest of broken rising megaphone support from last November which I have currently in the 1780-5 area. SPX daily chart:
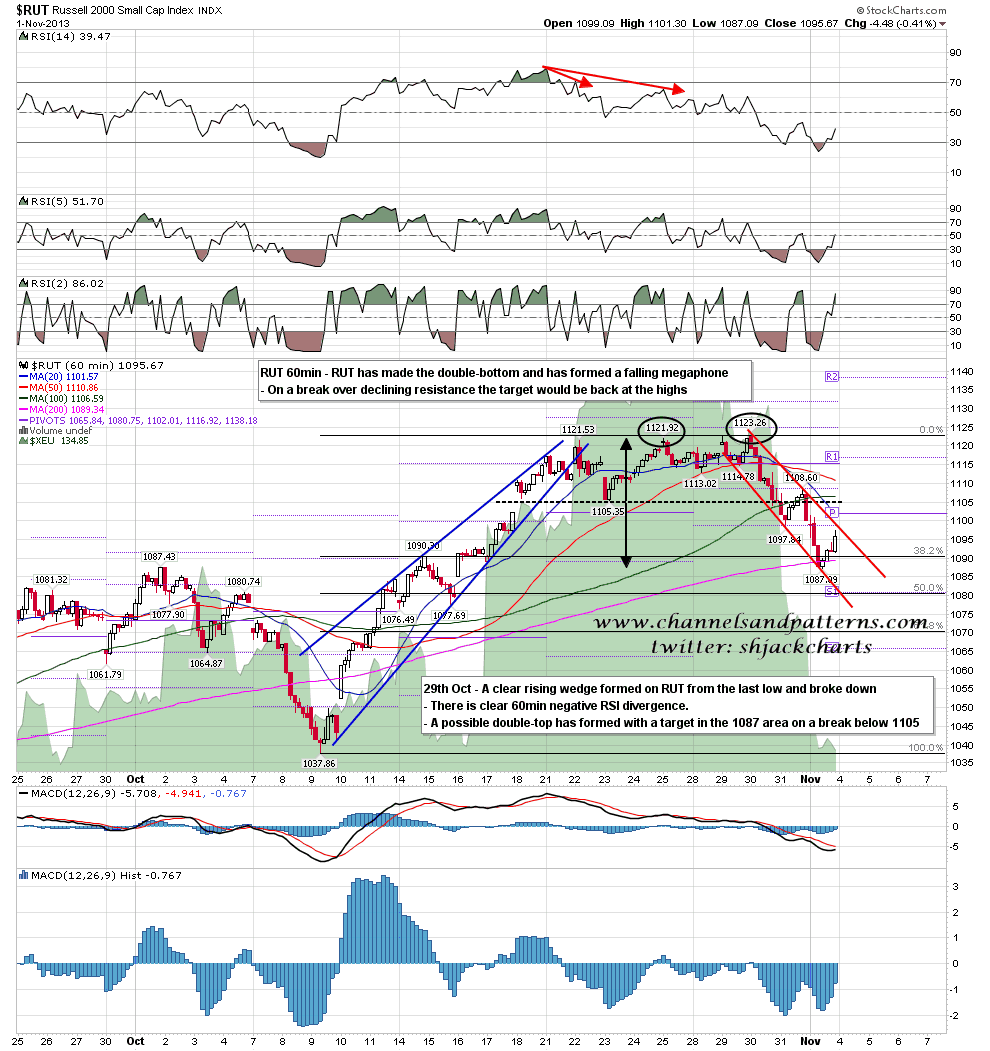
Last Tuesday I posted possible double-tops forming on NDX and RUT. The NDX pattern never broke down but the pattern on RUT did and made both the 38.2% fib retracement of the preceding move and the 1087 double-top target I gave then. A bullish falling megaphone has been forming from the high and if that breaks up today the target would again be a retest of the highs. RUT 60min chart:
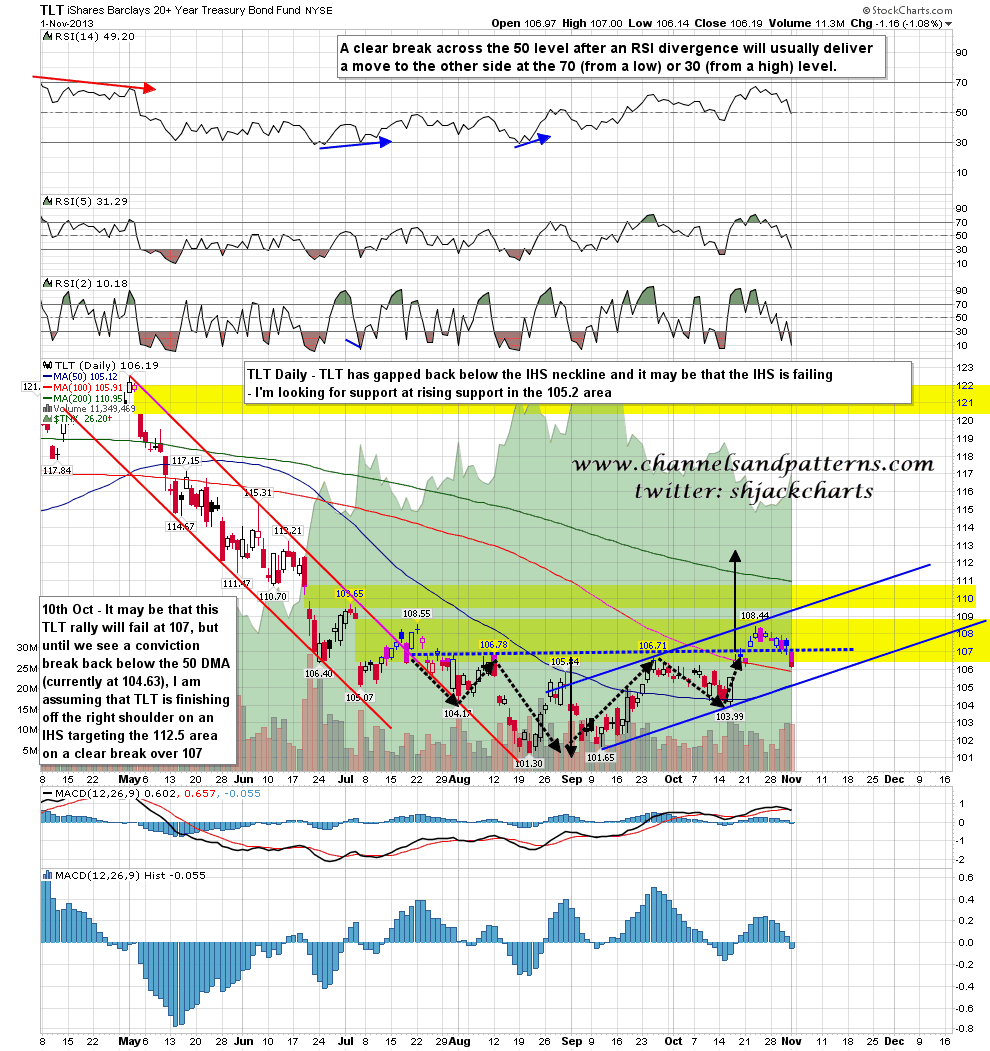
TLT gapped below the IHS neckline on Friday and it may be that this IHS is failing. I have rising support in the 105.2 area and if TLT breaks below that I’d be inclined to write the IHS off. My confidence in a strong rally on bonds without any end in sight for QE isn’t that high in any case. TLT daily chart:
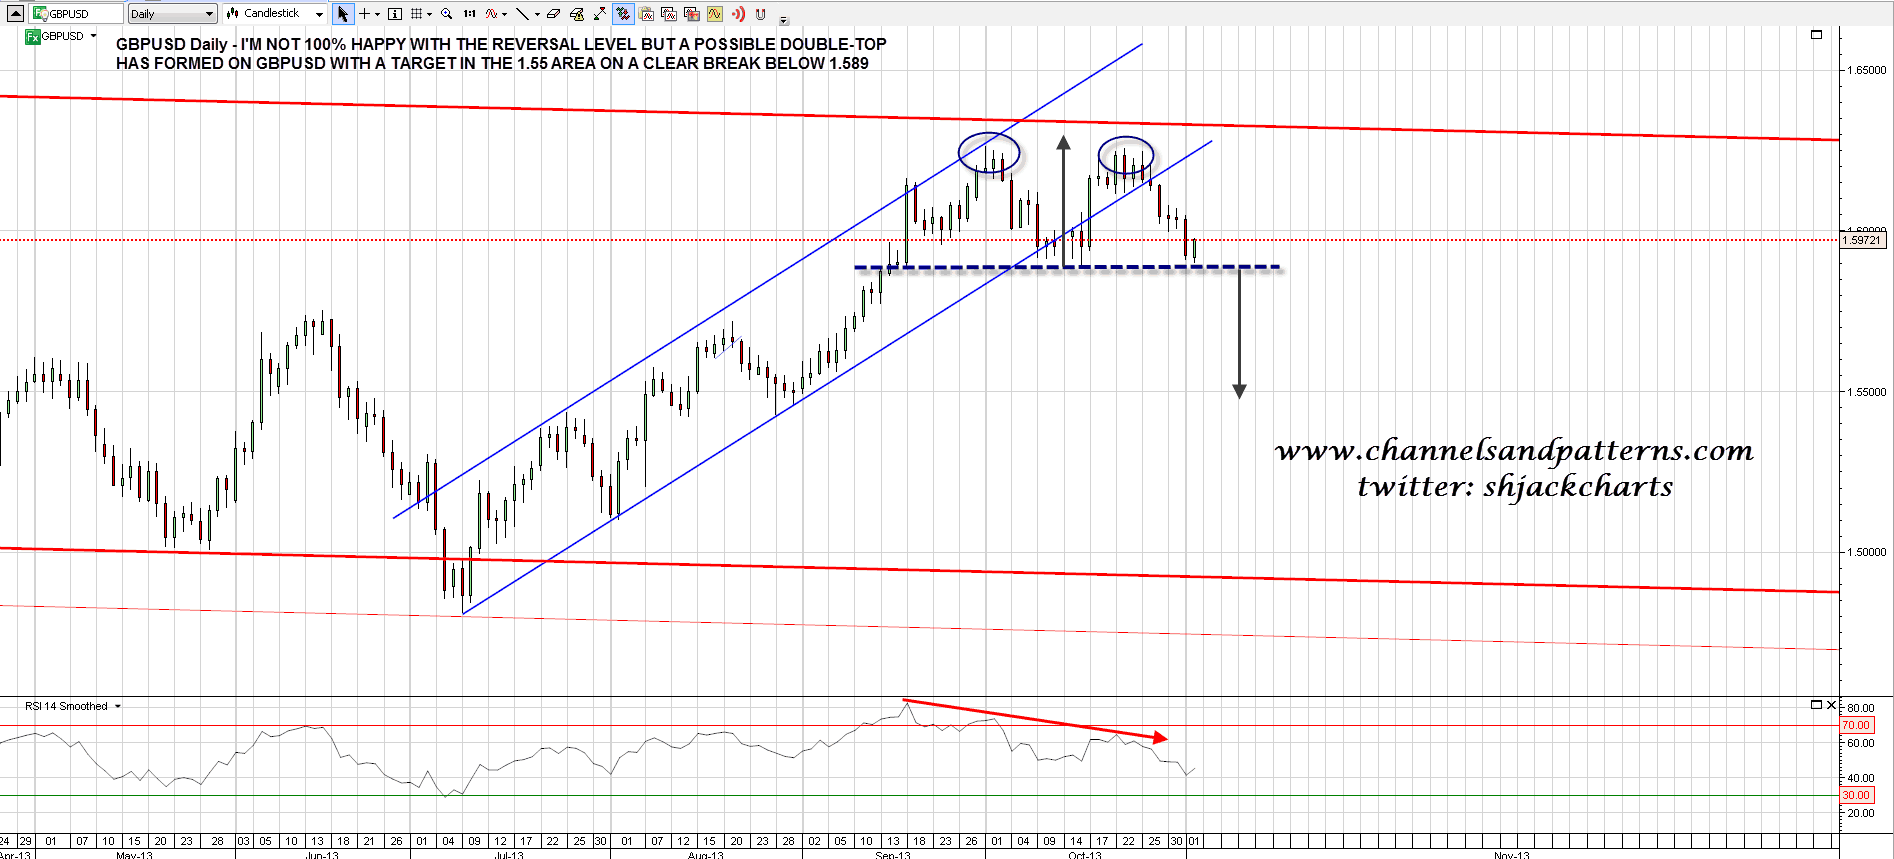
For reasons I showed on Friday morning I’m not 100% happy with the current reversal level on GBPUSD, but a double-top has now formed, and on a clear break below 1.589 the target would be in the 1.55 area. GBPUSD daily chart:
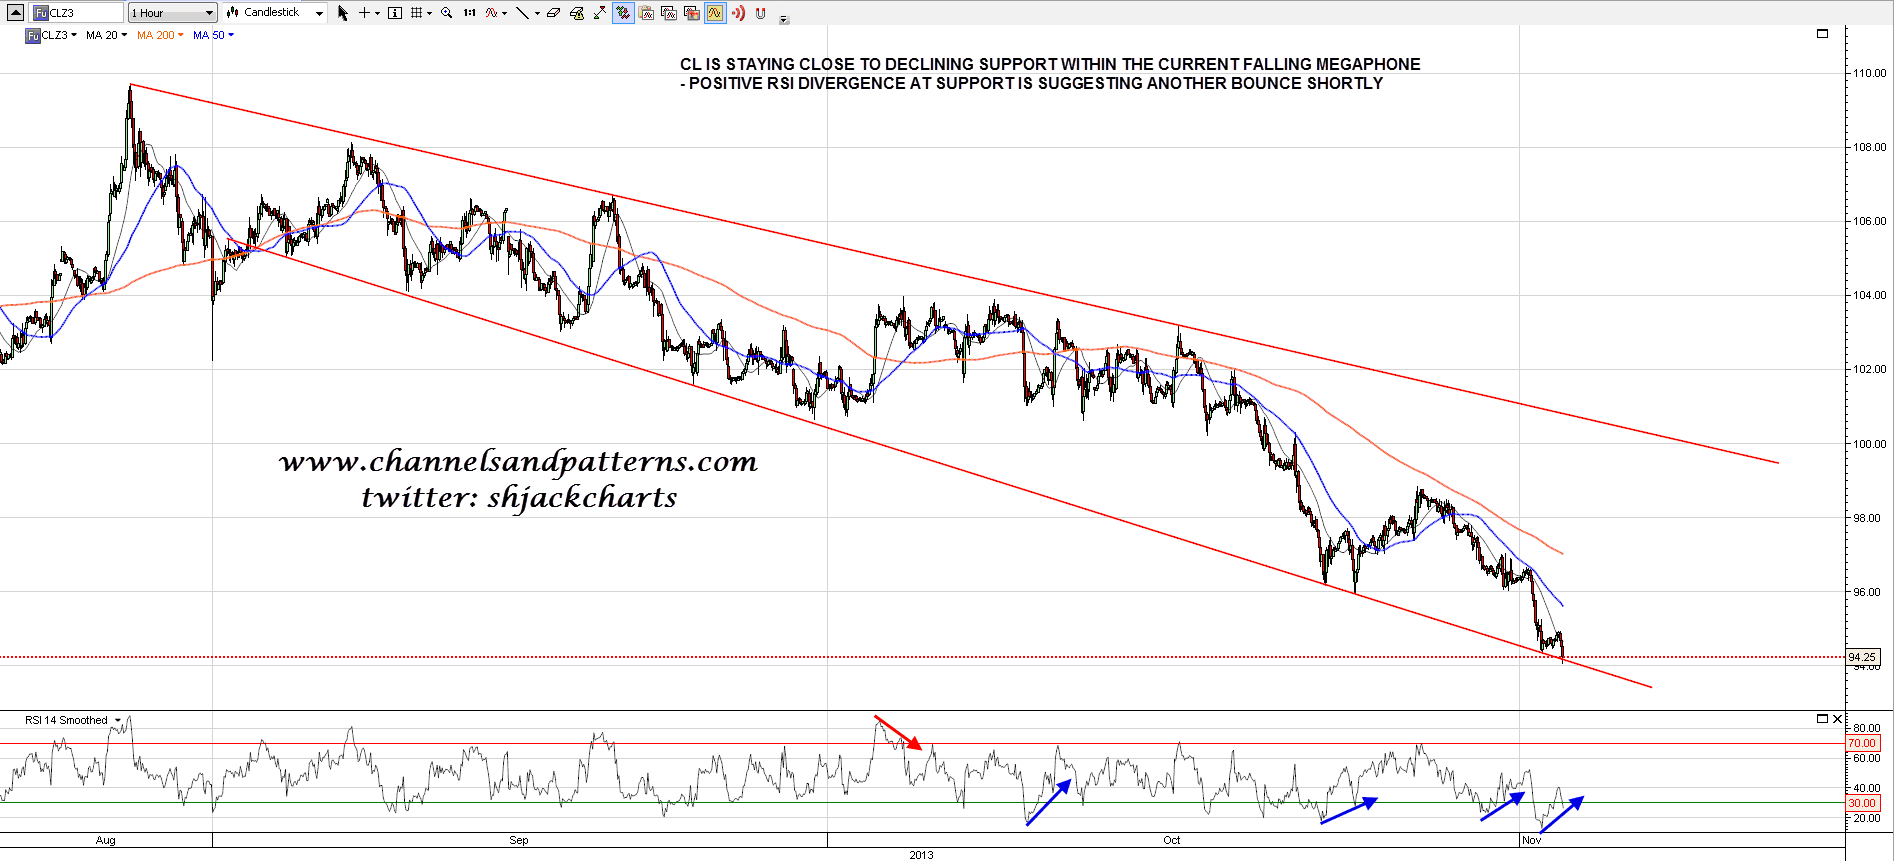
CL has been staying close to falling megaphone support but more positive RSI divergence has now developed suggesting a bounce soon. CL 60min chart:
The afternoon high on Friday was at 1764 SPX /1759 ES. For the bears to have a decent shot today the open must be at or underneath that level and be followed by swift retreat down from declining resistance on SPX. If we see a gap over that resistance trendline I’ll be looking for a retest of the highs and a high this week in the 1775-90 range.
