
I’m expecting to see a short term high soon, and that might turn out to be a very significant high that will last months. Generally before a significant high we would see equities test the water, as it were, with a first decline before the main high. I suspect strongly that is what we are seeing at the moment, so I’m expecting this move to have limited further downside and to be followed by (probably marginal) new SPX highs in the near future.
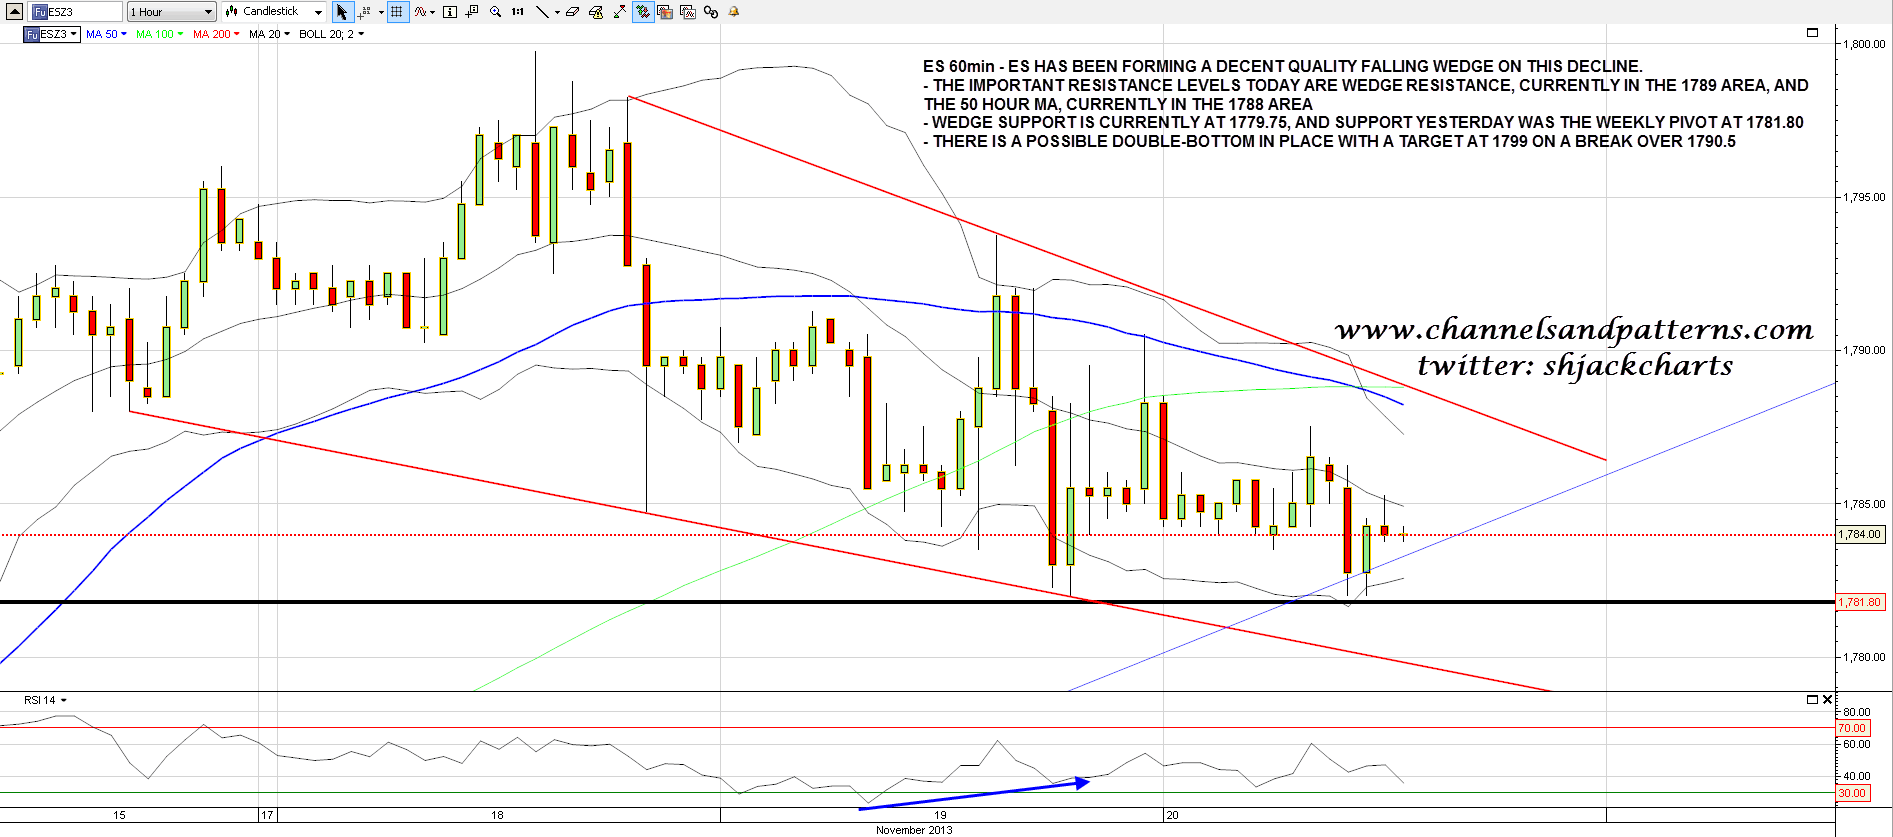
On ES a decent quality falling wedge has formed from the recent high. I have resistance at 1788/9, with the 50 hour MA at 1788 and falling wedge resistance at 1789. Support yesterday was at the weekly pivot at 1781.8, and I have falling wedge support just under 1780. There is a possible double bottom forming that would target 1799 on a break over 1790.5. ES 60min chart:
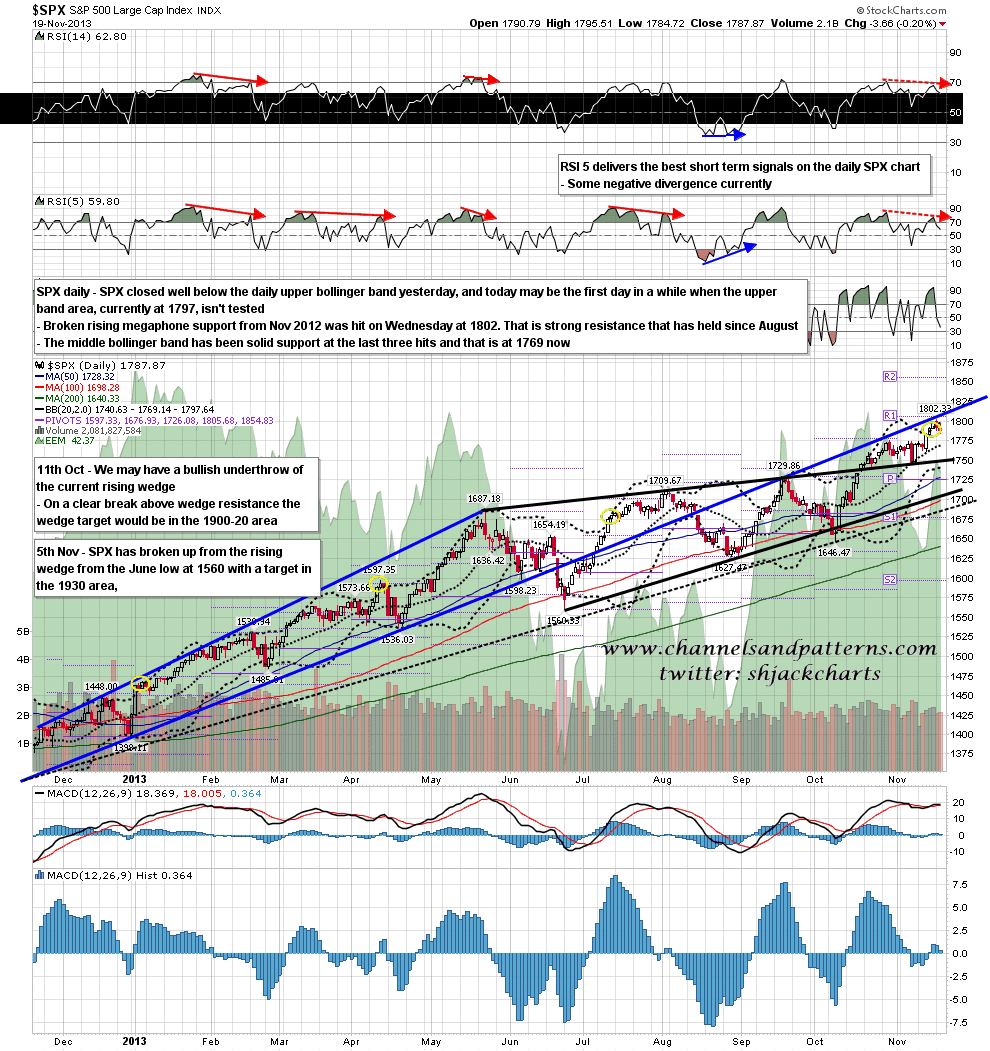
SPX closed well below the daily upper bollinger band yesterday, but of course the upper band was still tested intraday. If we see a day without such a test today then there will be a strong case for a test of the middle band, currently at 1769. SPX daily chart:
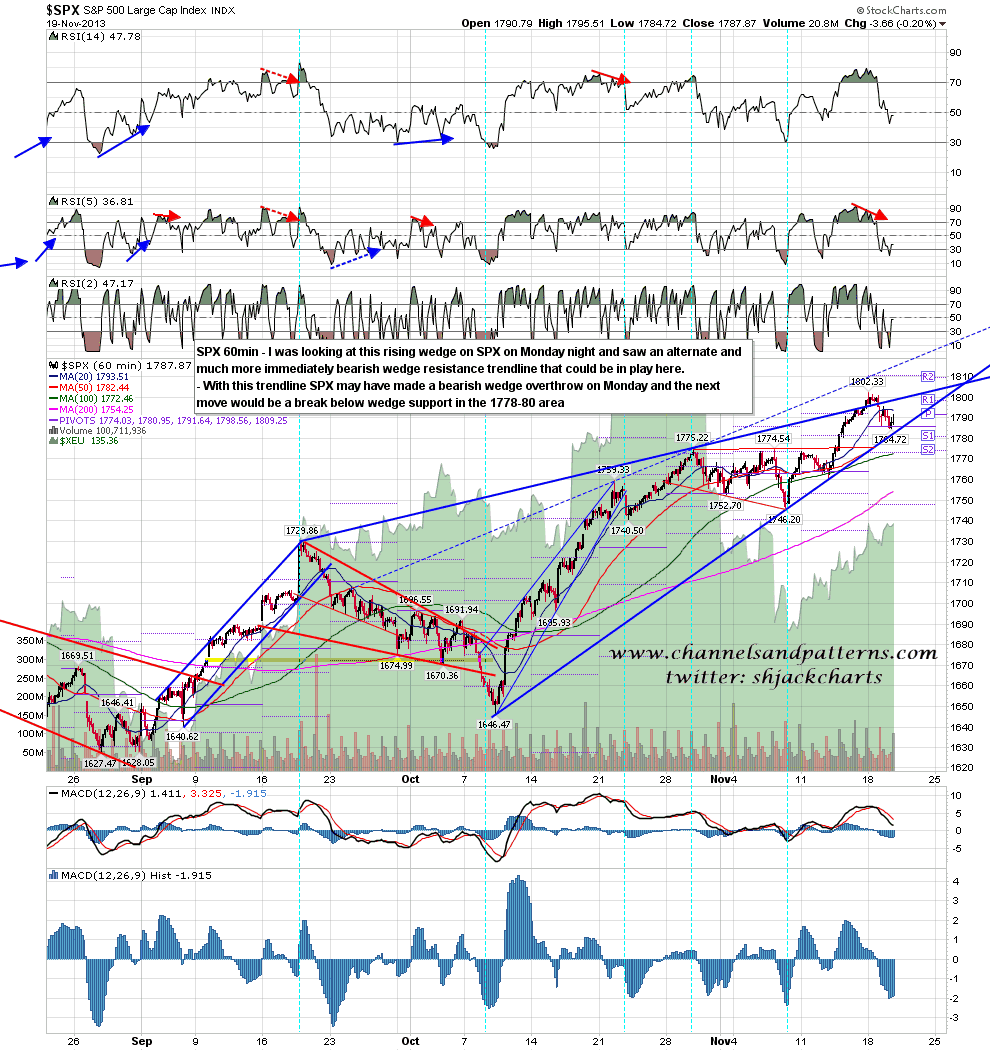
On the SPX 60min rising wedge support has not yet been tested. If the higher wedge trendline is correct I wouldn’t expect it to be tested. If the lower wedge trendline is correct then I would expect it to break. Either way there would most likely be a retest of the highs afterwards. SPX 60min chart:
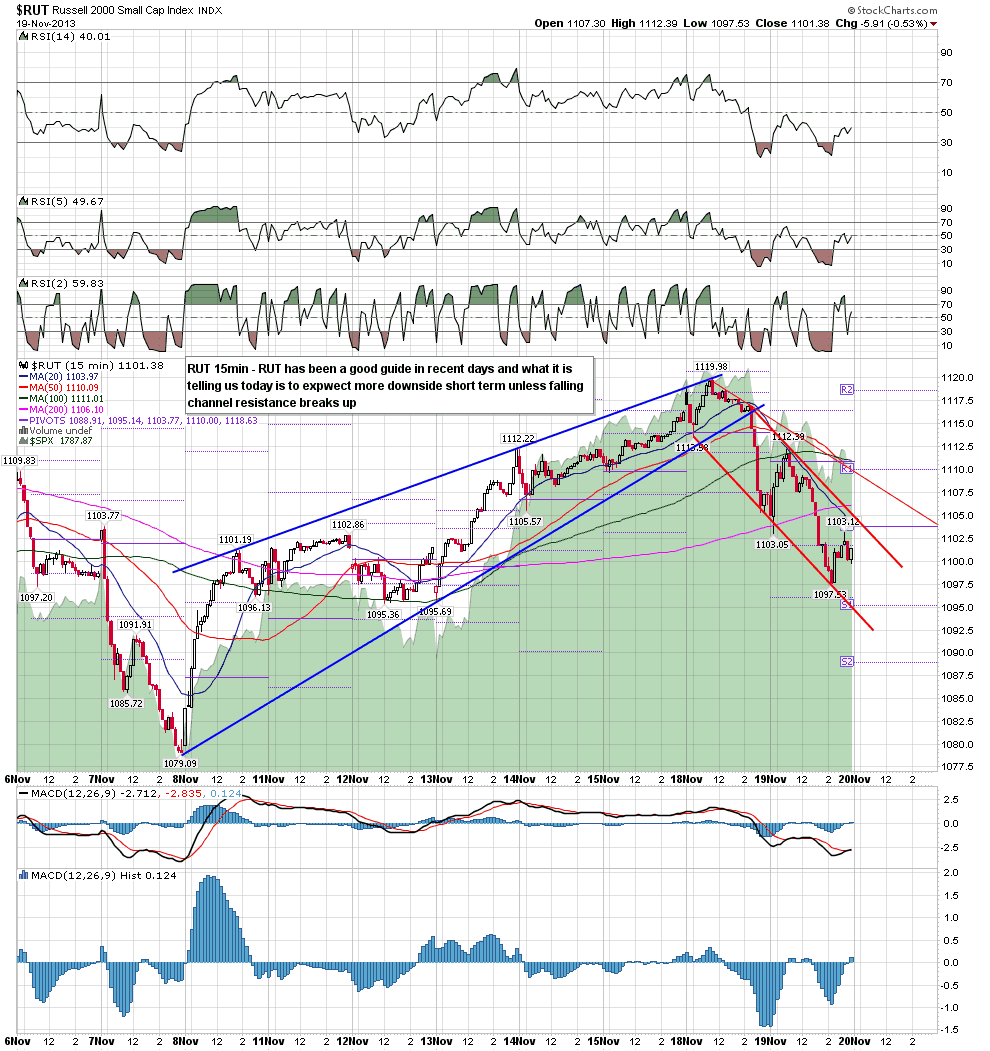
RUT has been a decent guide to events in recent days and I’ll be looking towards it for confirmation of any upward breakout today. Confirmation would be in the form of a 15min candle close significantly above falling channel resistance. RUT 15min chart:
On other markets I’m expected to see the current lows on gold retested in the coming weeks. In the short term the bull side has nothing until current falling channel resistance can be broken. GC 60min chart:

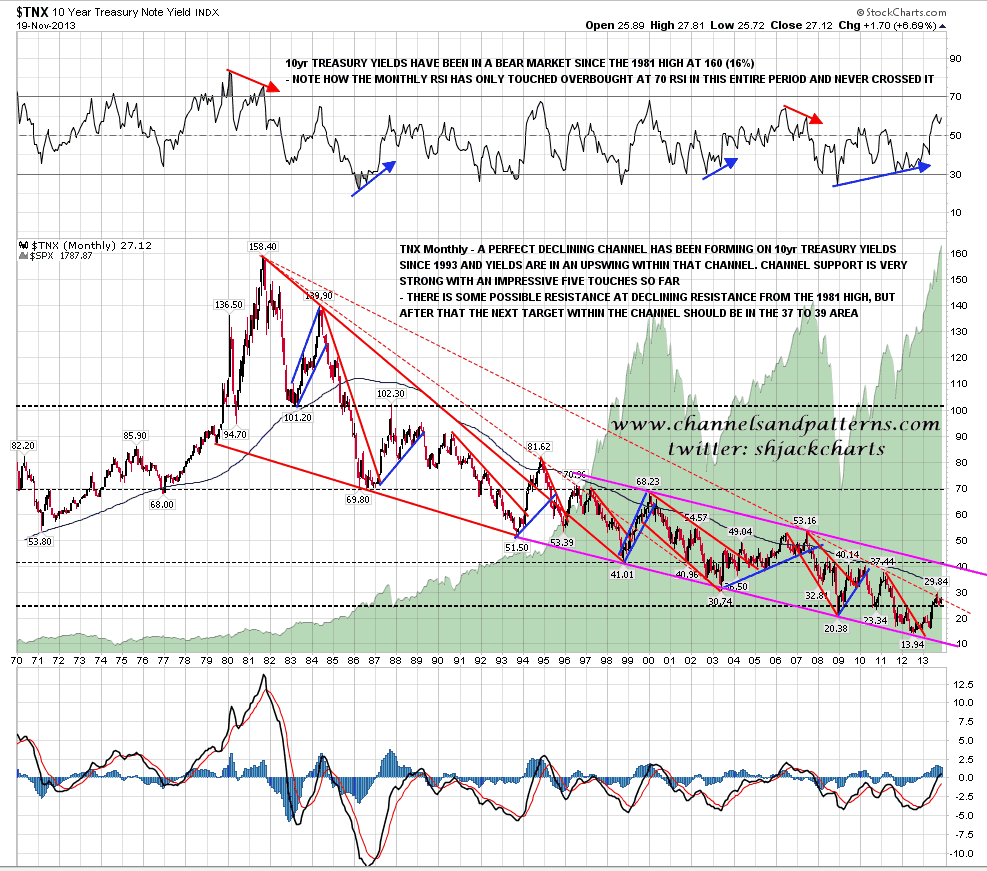
On bonds I am expecting the next move to be down. Looking at the (inverted) picture on the TNX 10yr Yields chart the consolidation in recent weeks has been retesting broken W bottom resistance while forming a bull flag. The next obvious move is to test falling channel resistance in the 37-9 area (3.7%-3.9%). in the absence of any tapering I am expecting that move to start soon. TNX monthly chart from 1970:
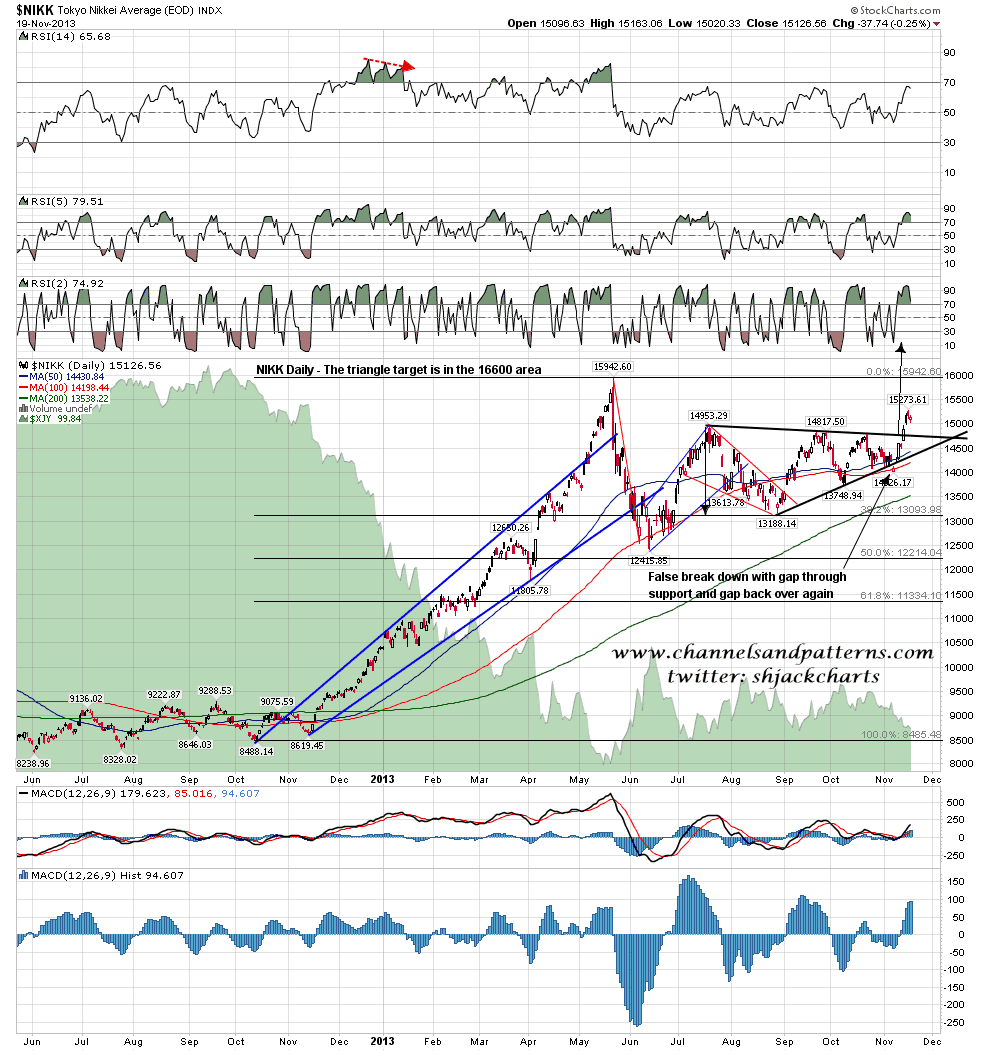
I was looking at false breaks on triangles yesterday morning and a reader pointed out the current example on the Nikkei. It is indeed a beauty with a very nice false break made with a gap below triangle support and then a gap back above it. I have the upside target in the 16,600 area and if we see a retest of broken triangle resistance that would be a very nice long entry. What is this telling us about the next few months on SPX? Possibly nothing but the retest and play out scenario would be perfect fit with a decent retracement soon on SPX followed by a push up into a spring high. NIKK daily chart:
Since I started writing ES has broken over wedge resistance and opened a new hourly candle above the 50 hour MA. I am leaning bullish and looking for long entries subject to RUT confirmation at the open. I would mention again the possible double-bottom on ES with a target at 1799 on a break over 1790.50.
