
New Fed Chairgnome Yellen will be addressing Congress this morning, addressing the very serious problem of deflation at the Fed and detailing her plans for tackling it. As you can see from the image below this is a serious issue, which if not addressed may mean that financial policy may be determined by a leprechaun in the easily foreseeable future, and possibly even a gerbil a decade or two further down this path. A committee is looking into whether that would be likely to have a positive or negative impact on the quality of Fed policy. Deflation at the Fed since 1980:

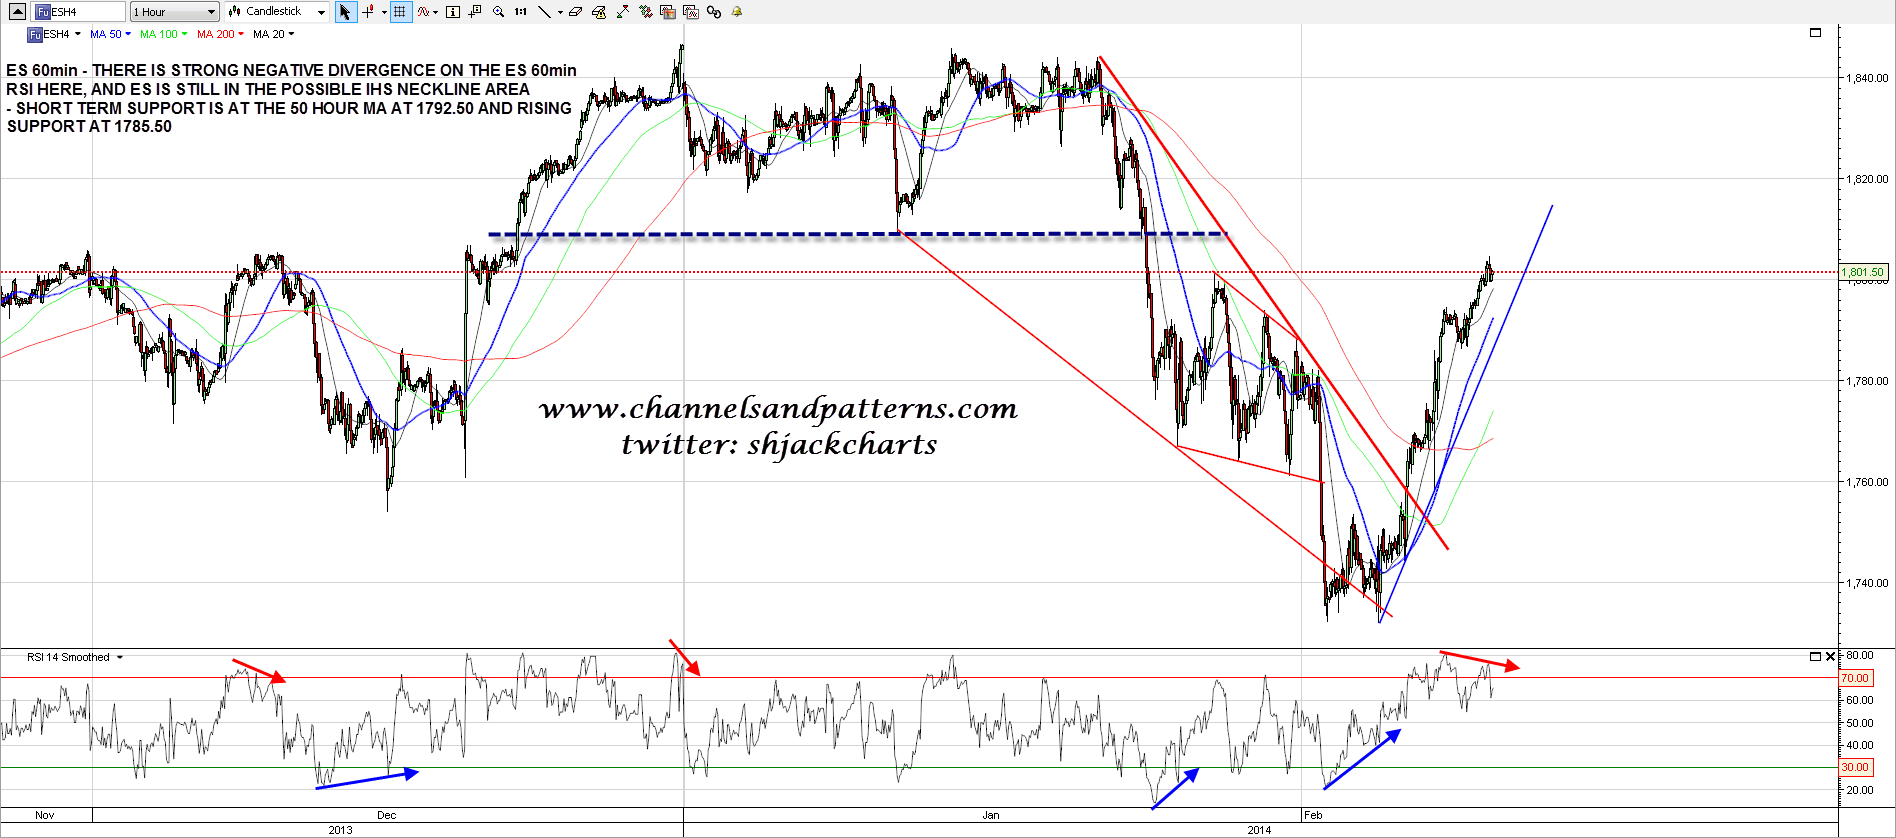
Joking apart however, I’m thinking that the Yellen action this morning, with her well trailed confirmation that tapering will continue on the current path for the moment, may well spur the retracement I was looking for, but didn’t happen, yesterday. The ES chart looks ready to turn, with strongly negative 60min RSI divergence and some support at the 50 hour MA at 1792.50, and rising support currently at 1785.50. I’m leaning towards a retracement that at least tests rising support, and would ideally go further to test the 1766-70 area that would be the ideal right shoulder low for the possible IHS patterns that are still in play here on ES and SPX. ES 60min chart:
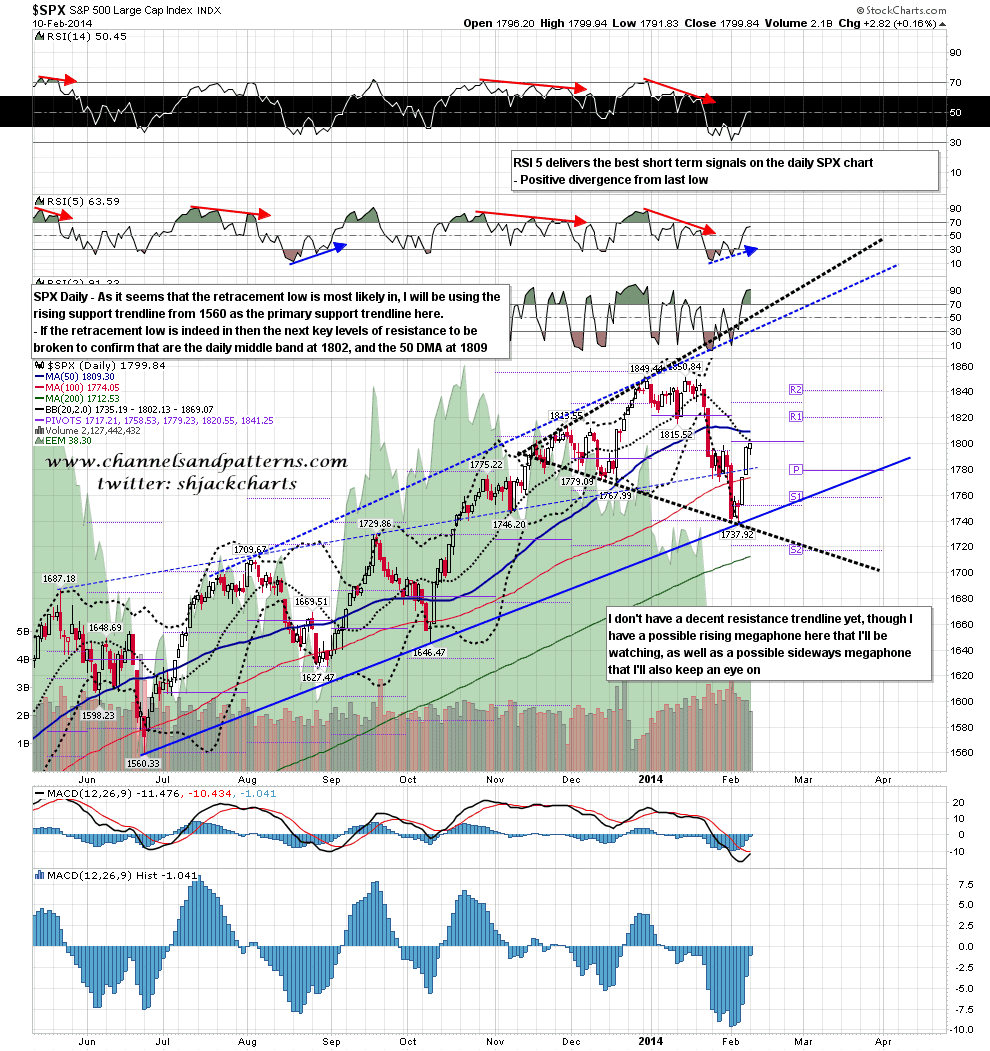
In terms of resistance the next real test on SPX is the daily middle bollinger band which closed yesterday at 1802. Yesterday’s high was 1799 which I would count as a technical hit, so if we reverse today that would be a reversal from a test of the middle band. a few points higher is the also significant 50 DMA at 1809, and that is near the 61.8% fib retracement of the decline from 1850, though a test of 1809 would make an IHS forming here much less likely. SPX daily chart:
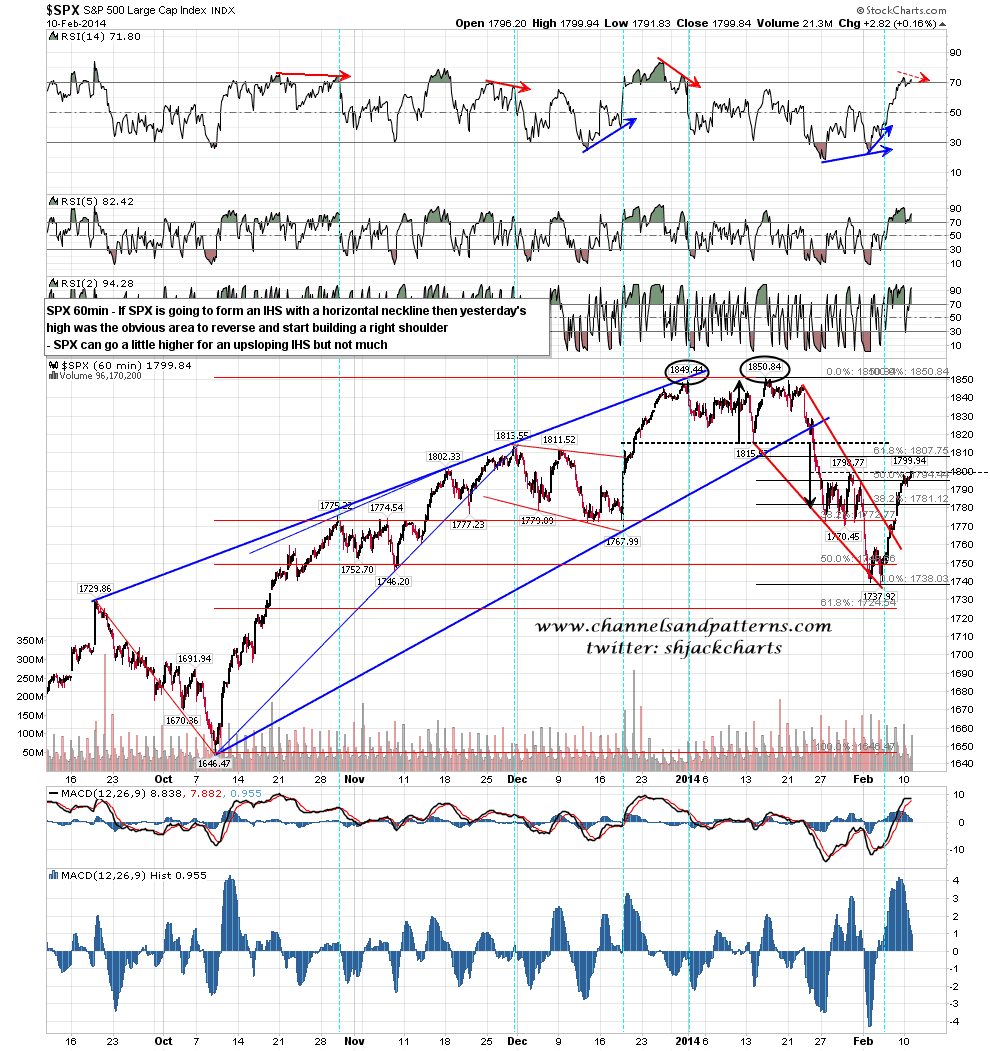
SPX is now at the top of the possible IHS neckline area and would ideally reverse here if we are going to see an IHS form. SPX could go a little high within the IHS scenario but not much. SPX 60min chart:
Looking at other equity indices Dow is lagging SPX slightly, but has reached a possible IHS neckline there. As with SPX there is some negative RSI divergence here but not strikingly so. INDU 60min chart:

NDX is leading at the moment and has already passed the targets I gave last week. The next obvious target is a test of the highs. NDX 60min chart:

RUT is a laggard here, and has some way to go to reach the lowest of the targets I was looking at last week. Even after this correction the current P/E ratio on RUT is 74, so RUT may now underperform for years to get the P/E ratio back down into sane territory. RUT 60min chart:

I am looking for a retracement here, and there are decent odds that we may see one today. This should deliver sustainable rising support trendlines for this wave up, and just possibly a rally high, though for reasons I showed yesterday, a resumption of the downtrend here looks like a very long shot. If we see a break back below 1770 SPX with any conviction I will start to look again at the bear case, but I would be surprised to see that happen. My main scenario here is that we have started the wave up towards my wedge target in the 1965 SPX area.
