
My main trading partner is Mike Vacchi, who I mention regularly. We trade every day in his room at Princeton Trader. Mike has a system that he has been using for ten years or so to identify levels where the market is either extremely overbought or oversold, and they are set at distances from the 45 day pivot. That is at 1942.13 today and we have now spent an unprecedented (in the last ten years) five days now trading around the ‘Crazytown’ level at 70 points over the pivot. At 80 points over it is the ‘Bet The House’ level and ES hit that overnight and traded there awhile. That level can be overshot, but rarely for more than a few hours without a significant retracement starting. I am short from Bet the House and actively looking for that retracement here.
The resistance trendline on the daily SPX I’ve been looking for as resistance was hit on Tuesday, and we might see a higher high over that today. If this trendline holds that high would be marginal and should be the second high of a small double top. SPX daily chart:

If we see that double top play out today the target would be a fairly modest pullback to the 2022 SPX area. It’s worth noting that the ES weekly pivot is currently at 2017, which is a match with that level. SPX 1min chart:

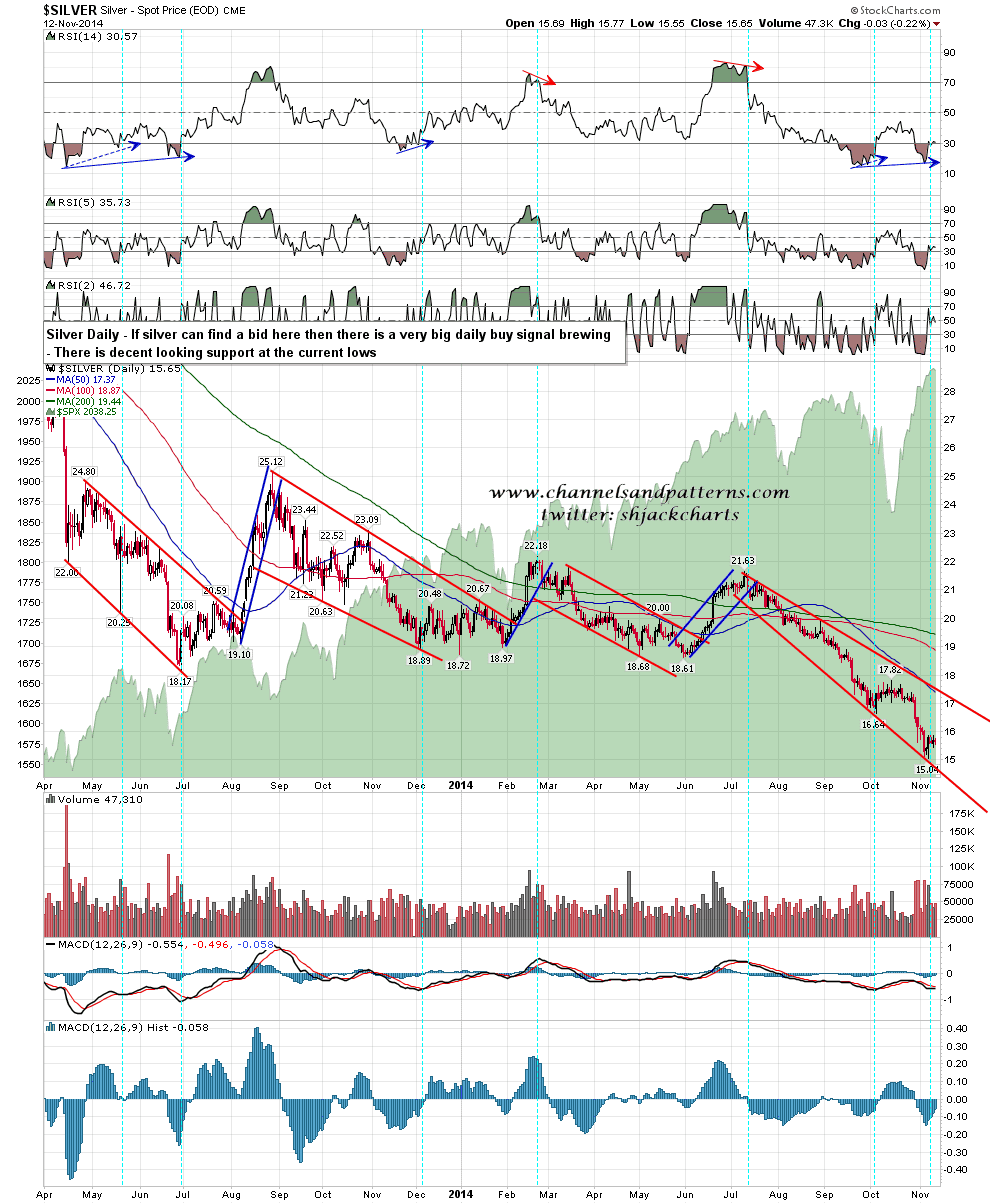
Silver is looking as though it should bounce here short term. That’s a decent fit with the toppy looking action in USD. Silver daily chart:
I’m hearing a lot of talk that we could spike up hard here towards 2100, and that is possible. Almost anything is possible. However the historical odds really don’t favor seeing that move without a decent retracement. I’m positioned short waiting for it.
