
I’ve been having a few technical problems this morning with my main computer, and currently have no ability to edit charts at Stockcharts and browser access only to my main broken. I should have these issues fixed later but for now I’ll be using charts I did yesterday and a futures chart for CL.
There are clear bull & bear scenarios here and I’m leaning strongly towards the bear scenario, but with the strong awareness also that there is a huge wild card today in the shape of the Fed at 2pm, so I’m keeping an open mind.
The bull scenario is on the SPX daily chart that I posted on twitter yesterday afternoon, and that is showing that the low yesterday was a decent retest of broken falling wedge resistance from the all time high. If that low holds we would now see a break over range resistance at 2064 and at least a test of the all time high. SPX daily chart:
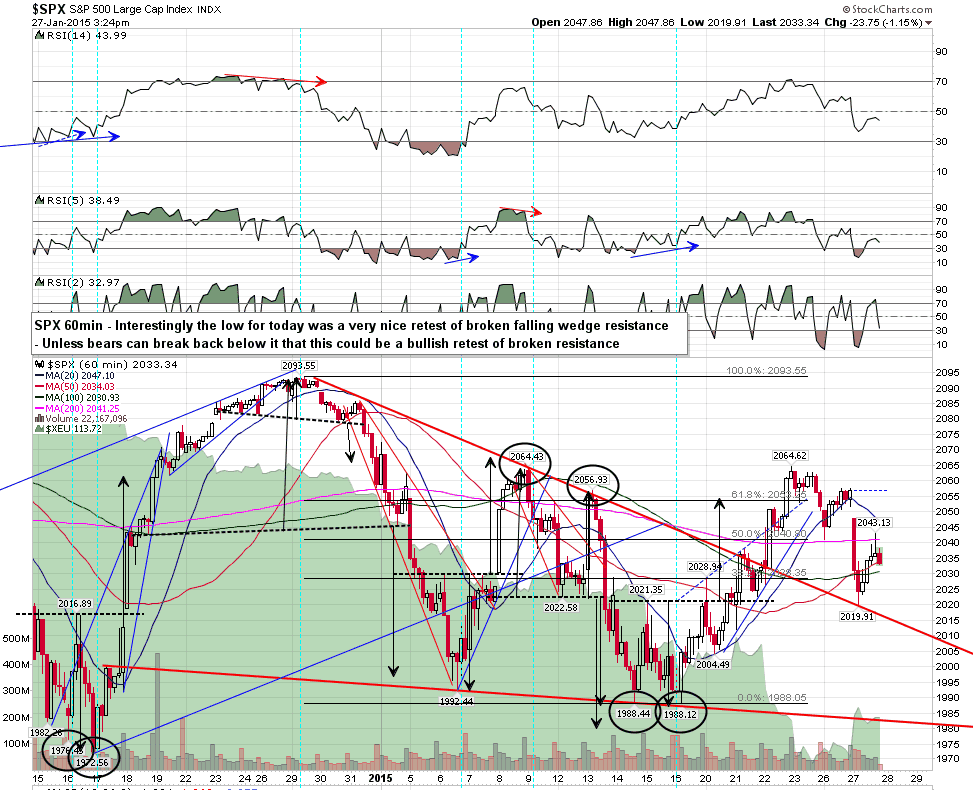
The bear scenario is the same as before, with a break soon of the current retracement lows and an ideal target at weekly rising megaphone support, currently in the 1875 area but very possibly to be hit in the 1885-1910 range as it is rising quickly. That is supported by the conviction break yesterday below the daily middle band, currently at 2039, and would most likely only be killed by a conviction break back above that middle band today on a daily close basis.
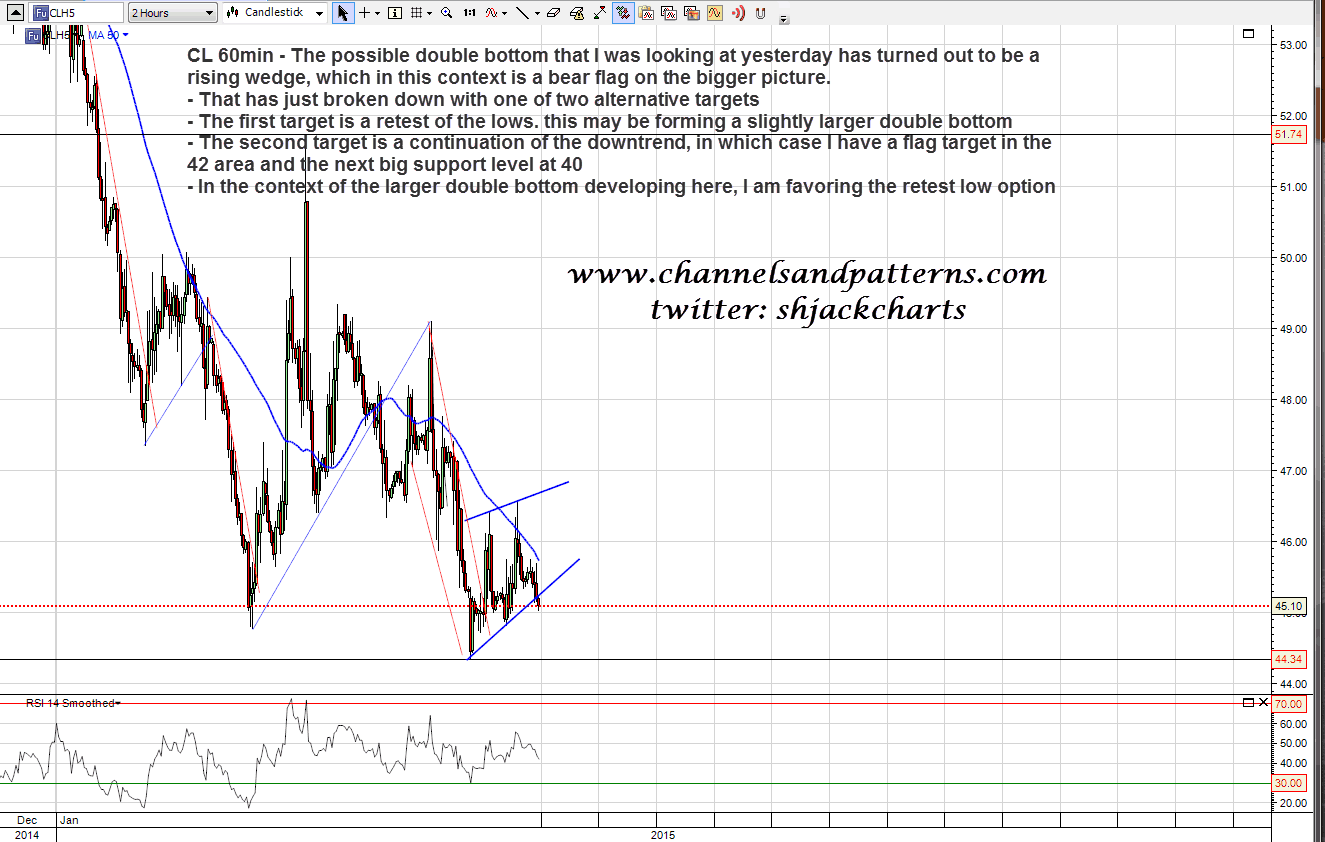
On oil the small double bottom setup that I was looking at yesterday morning turned out to be a rising wedge, which in this context is a bear flag. That has broken down and the first of the alternate targets is just a retest of the lows. I’m expecting that soon. The second alternate target is a resumption of the downtrend, with an obvious flag target in the 42 area. In the context of the likely larger double bottom forming here I’m leaning towards the first target at the lows retest, but either would fit with the second low of that larger double top. CL 60min chart:
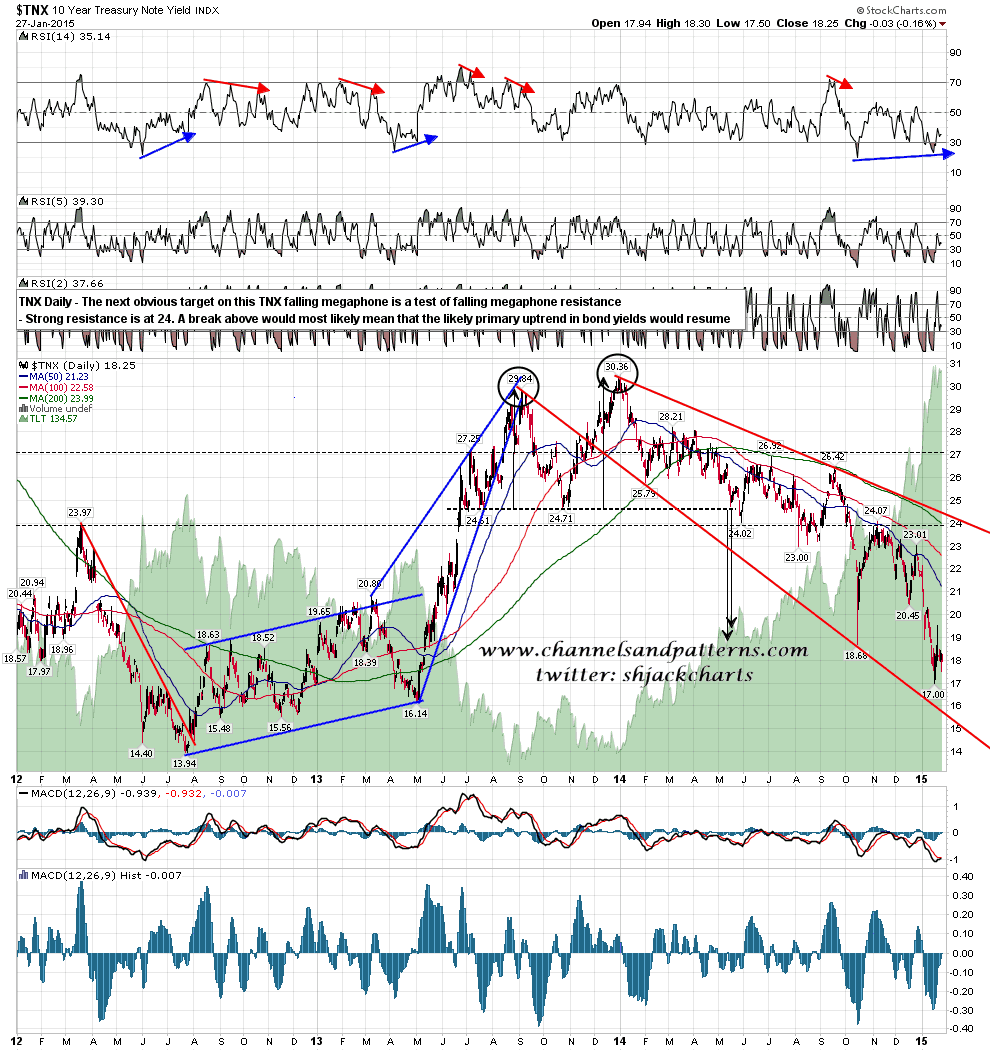
I’ll be talking about bonds more in the near future, but for now I’ll just post the chart below showing the large falling megaphone on TNX (10yr treasury yields) and add that after quite a bit of thought I’m now looking for a major high in the near future on bonds, after which we may well see all gains since the start of last year wiped away, and more. Something to bear in mind now and I’ll be explaining my view in detail soon. TNX daily chart:
We could see a big move today. If that move takes out yesterday’s low at 2019 then I would expect follow through to the downside on the bear scenario. if instead we see a break back over the last high at 2057 then I’d be looking for a retest of the highs on the bull scenario. I’m leaning bearish but with the Fed at 2pm today it could go either way.
