
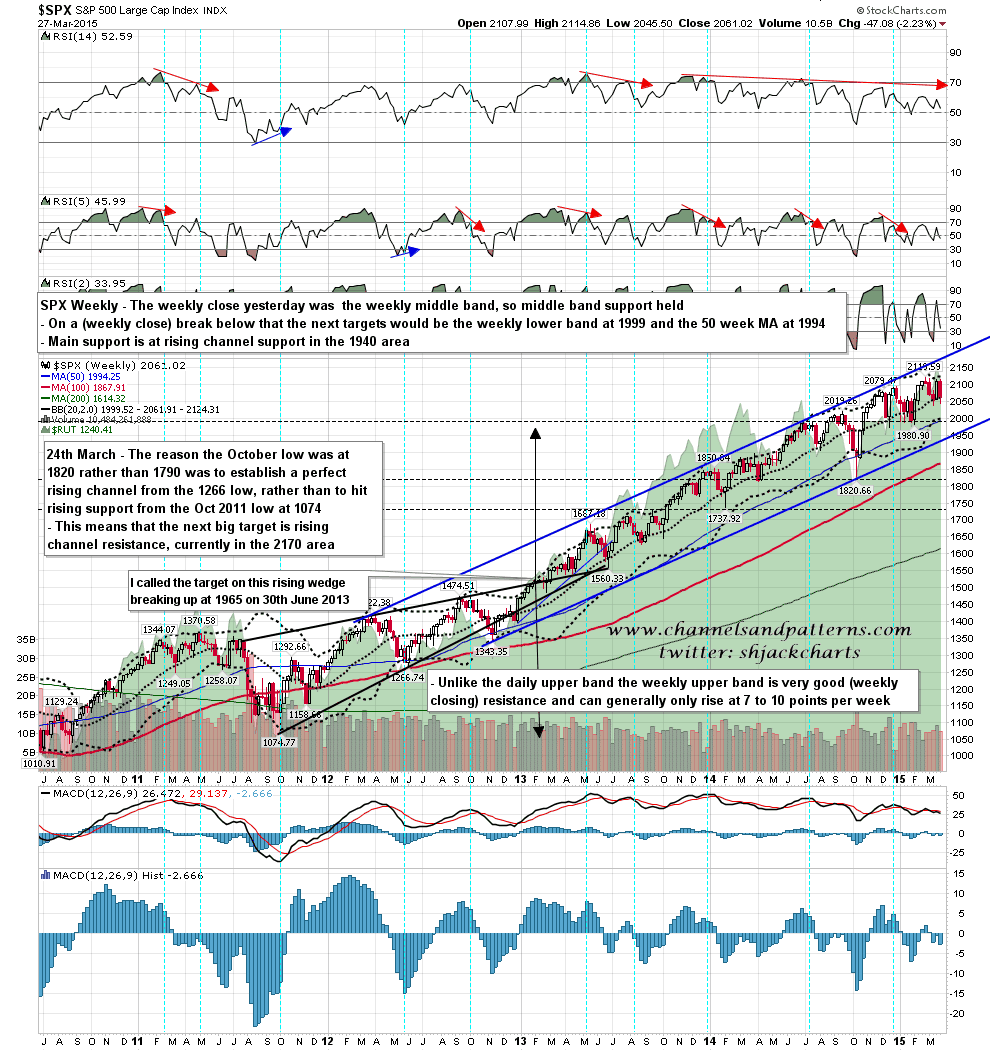
SPX closed within one point of the weekly middle band on Friday so that very important support there held. While I am looking for some more downside I’m expecting that to hold again this week. SPX weekly chart:
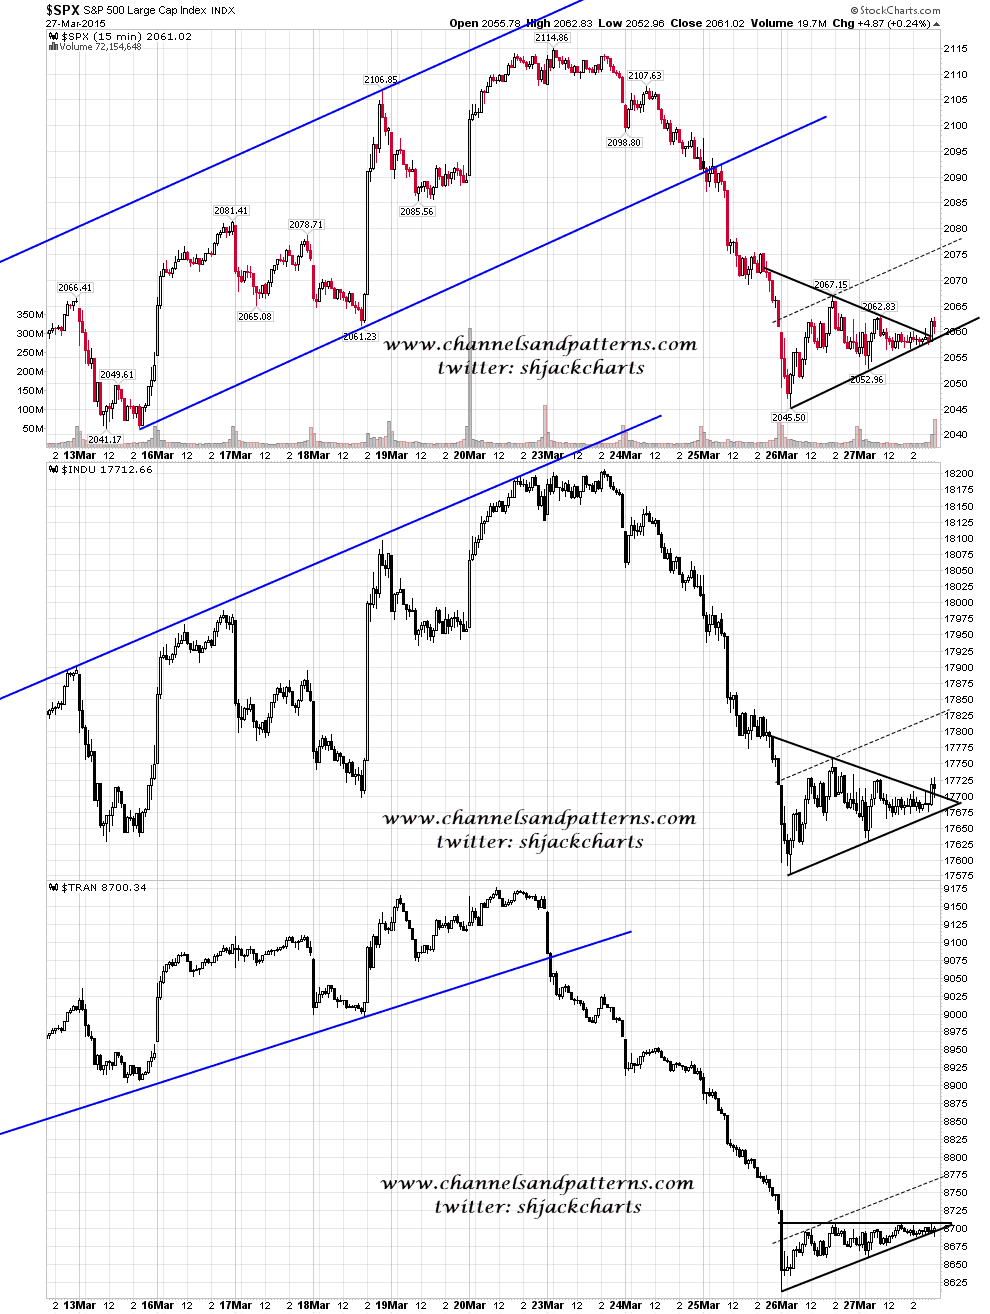
Equities have been strong overnight and it’s clear that the triangles formed at the end of last week are breaking up. Nonetheless the triangles on all six of the indices below should be bear flags forming and I have sketched in the idea flag resistance targets on SPX, Dow and TRAN. Screen 3x 15min SPX INDU TRAN:
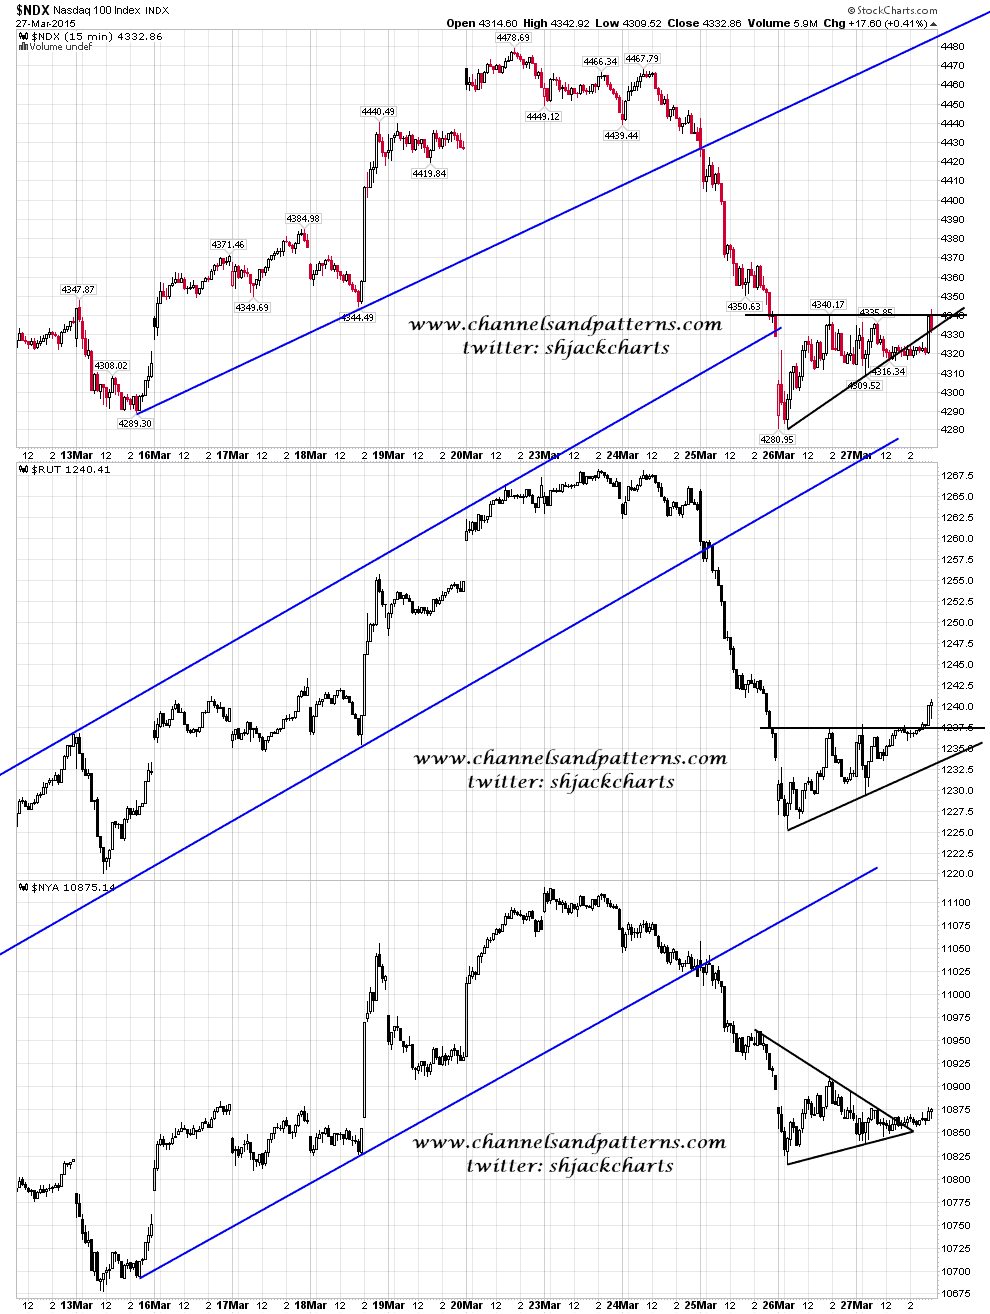
Screen 3x 15min NDX RUT NYA:
My stat that the 2039 low must be broken before new highs are made is still outstanding, and I’m not yet seeing any strong evidence that it won’t be. The historical stats for the first two days of March are bearish. Let’s see how this gap up fares today.
