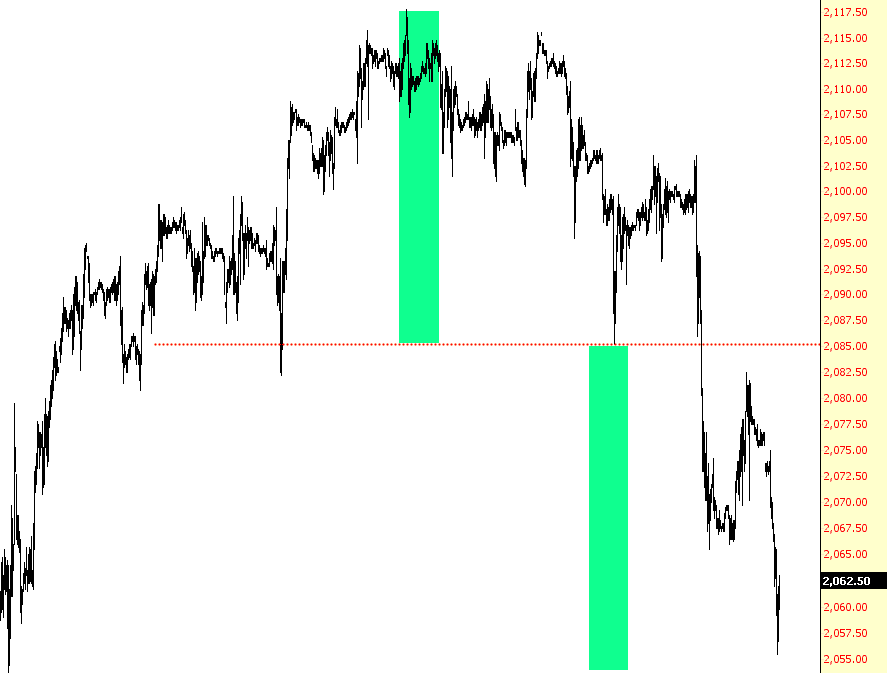
I had a great looking setup in play last night, and I did the chart and saved it with some confidence that we would see an extension of the rally into the 2090 area today, and then fail into the H&S target at 2054/5. That setup was supported by an IHS that broke up yesterday morning, and clear declining resistance from the highs at the IHS target. That chart is below. SPX 15min chart:
Slope of Hope Blog Posts
Slope initially began as a blog, so this is where most of the website’s content resides. Here we have tens of thousands of posts dating back over a decade. These are listed in reverse chronological order. Click on any category icon below to see posts tagged with that particular subject, or click on a word in the category cloud on the right side of the screen for more specific choices.
That ES Pattern
Well, what a nice morning to wake up to – – a wall of red and assets falling all around. Huzzah! Those who watched me on Tastytrade yesterday may remember I specifically pointed out the topping pattern on the ES. This has worked out great, although the measured moved is only a few points south of here, so I may close up my big DIA short just to be done with it (but keep everything else).
Employment, the Economy & Interest Rates
In light of the positive February Employment report NFTRH 333 opened up with some discussion of the details (the devil after all, is in those details)…
Employment, the Economy & Interest Rates
The February Employment report was a strong +295,000 with unemployment dropping to 5.5%. In Friday’s Market Notes update we highlighted that per BLS this was a services-driven report as the leading edge of the economy, the smaller but key manufacturing and industrial sectors, have begun to decelerate (notably in forward-looking ‘New Orders’).
From FloatingPath.com (markups mine) we see the breakdown…

Simple As ABC
I was going to title this post “Told Ya So”, but I figured that was obnoxious, so we’ll keep it more innocently puerile. As I was going through charts (as I tend to do when I’m not driving the family hundreds of miles up and down California) I noticed three particularly interesting charts that I’ve pointed out as good shorts that are behaving themselves particularly well. In this QE-free environment, technical analysis is working one whole hell of a lot better, and this trio of stocks illustrates that nicely. First, there’s Alcoa, which is following its analog beautifully:


