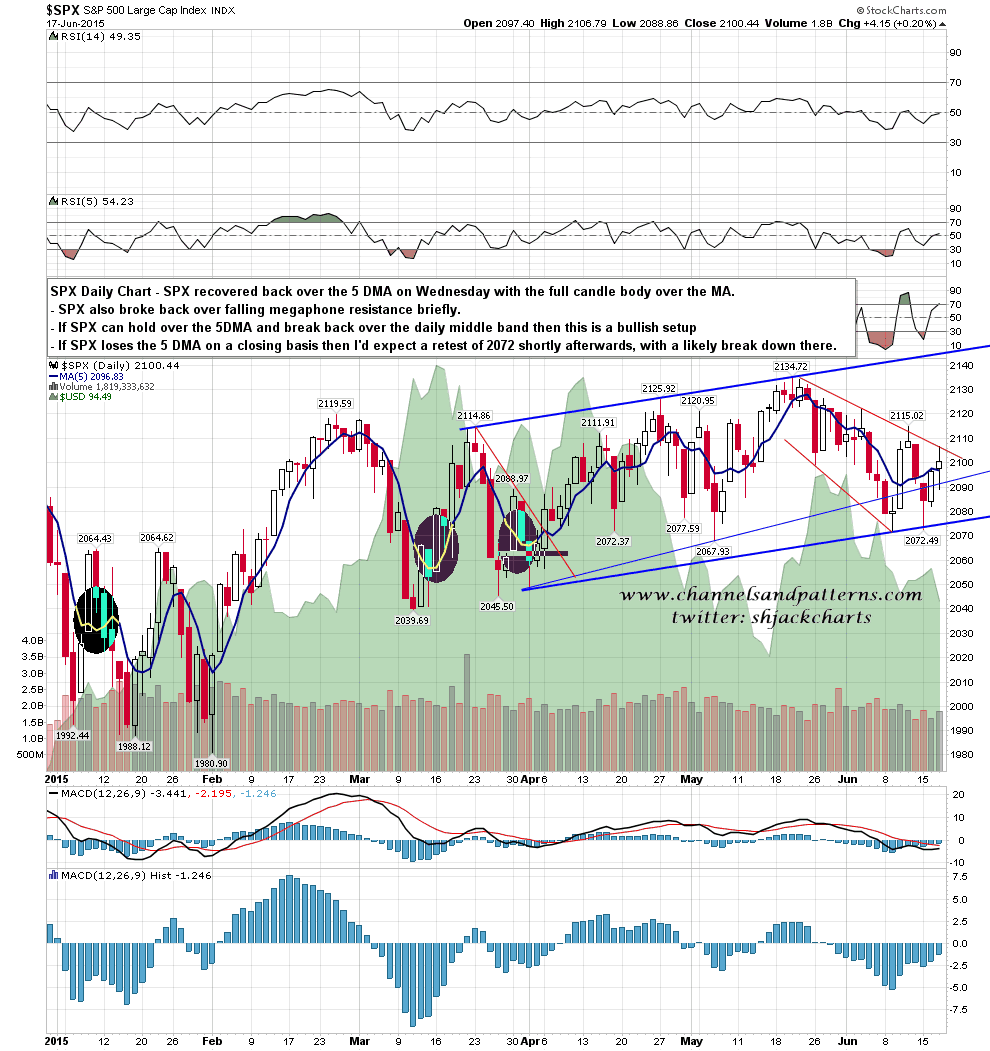
The bulls won FOMC on points yesterday, with a break back over the 5DMA, a test of the daily middle band, and a close on the 50 day EMA. Today they need to hold the 5 DMA (currently 2096) on a closing basis, with important support at the 50 hour MA just below at 2094.5. Above bulls need to break over the 50 DMA at 2104 and deliver a close more than a couple of handles over the daily middle band at 2106. If they can do that, then they can have a shot at retesting the all time high. SPX daily 5DMA chart:
Slope of Hope Blog Posts
Slope initially began as a blog, so this is where most of the website’s content resides. Here we have tens of thousands of posts dating back over a decade. These are listed in reverse chronological order. Click on any category icon below to see posts tagged with that particular subject, or click on a word in the category cloud on the right side of the screen for more specific choices.
Pao Wow
The latest news in the Silicon Valley legal soap opera around Ellen Pao appeared late yesterday: the Superior Court ordered Ellen Pao to cough up $276,000 to pay Kleiner Perkins for part of their legal fees spent defending themselves against her sex bias lawsuit. As you’ll recall: (a) she sued them (b) they offered her a million bucks to settle; she said no (c) she lost the suit in a very public fashion (d) they sent her a million dollar invoice and offered to waive it if she didn’t file an appeal (e) she appealed anyway (f) she lost the legal fees ruling.
Of course, the Pao legal team is declaring this a victory, since Kleiner wanted about four times this amount, but in my opinion, it would seem that Pao’s strategy during this entire case has worked against her.
Gold’s Ratio Signals
A brief snapshot of counter-cyclical gold’s macro signals vs. other metals (and broad commodities) that are more positively correlated to economies, using weekly charts…
Each week NFTRH updates many charts of nominal US and global stock markets, commodities, precious metals and currencies over multiple time frames. But we also cover economic data and indicators, with the first macro chart below (Palladium vs. Gold) still barely holding its economic ‘UP’ signal from January, 2013. At that time a coming economic up phase did not seem likely, but PALL-Gold and fundamental information gleaned from a personal source in the Semiconductor Equipment sector gave us a good risk vs. reward on that stance.
While it can be argued that using an indicator like Palladium (positive economic correlation) to Gold (counter cyclical) is subject to the discrete supply/demand fundamentals of the two assets, it has worked to signal up and down economic phases, with the most recent shown in Q1 2013 (green arrow). This indicator has been whipsawing since topping out a year ago and the moving averages are near a trigger point.

Historical FOMC Market Reactions
The horizontal lines on this SPY chart mark all FOMC meeting announcement days in since the beginning of 2014. Other than one exception following the December 17th, 2014 FOMC announcement*, the stock market traded lower within a few days to a couple of weeks.
*The rally that followed the December 17th FOMC announcement came on the heels of a 7 session, 5%+ correction in the SPY. Additionally, following the oversold/FOMC induced rally which peaked 7 days later, the SPY fell back sharply to the Dec 17th announcement level within just 5 sessions, quickly erasing that entire post-Fed rally.

Bottom line: While the primary trend in the market has been bullish in recent years, in nearly all instances, any post-FOMC announcement rallies were faded within hours or days. Taken in light with the current bearish technical posture of the equity markets, I would put good odds that the market will be trading lower within the next week or so.


