
Only time will tell whether or not the current bull market is just taking a breather or has already exhaled its final breath. With the recent 50/20-day ema death crosses as well as both long-term & short-term trendline breaks (in addition to other recent bearish technical developments), it would appear that, at the very least, the markets are at a critical technical juncture at this time. (Note from Tim: this post is outstanding and timely; click on any of the thumbnails for a much bigger graph):
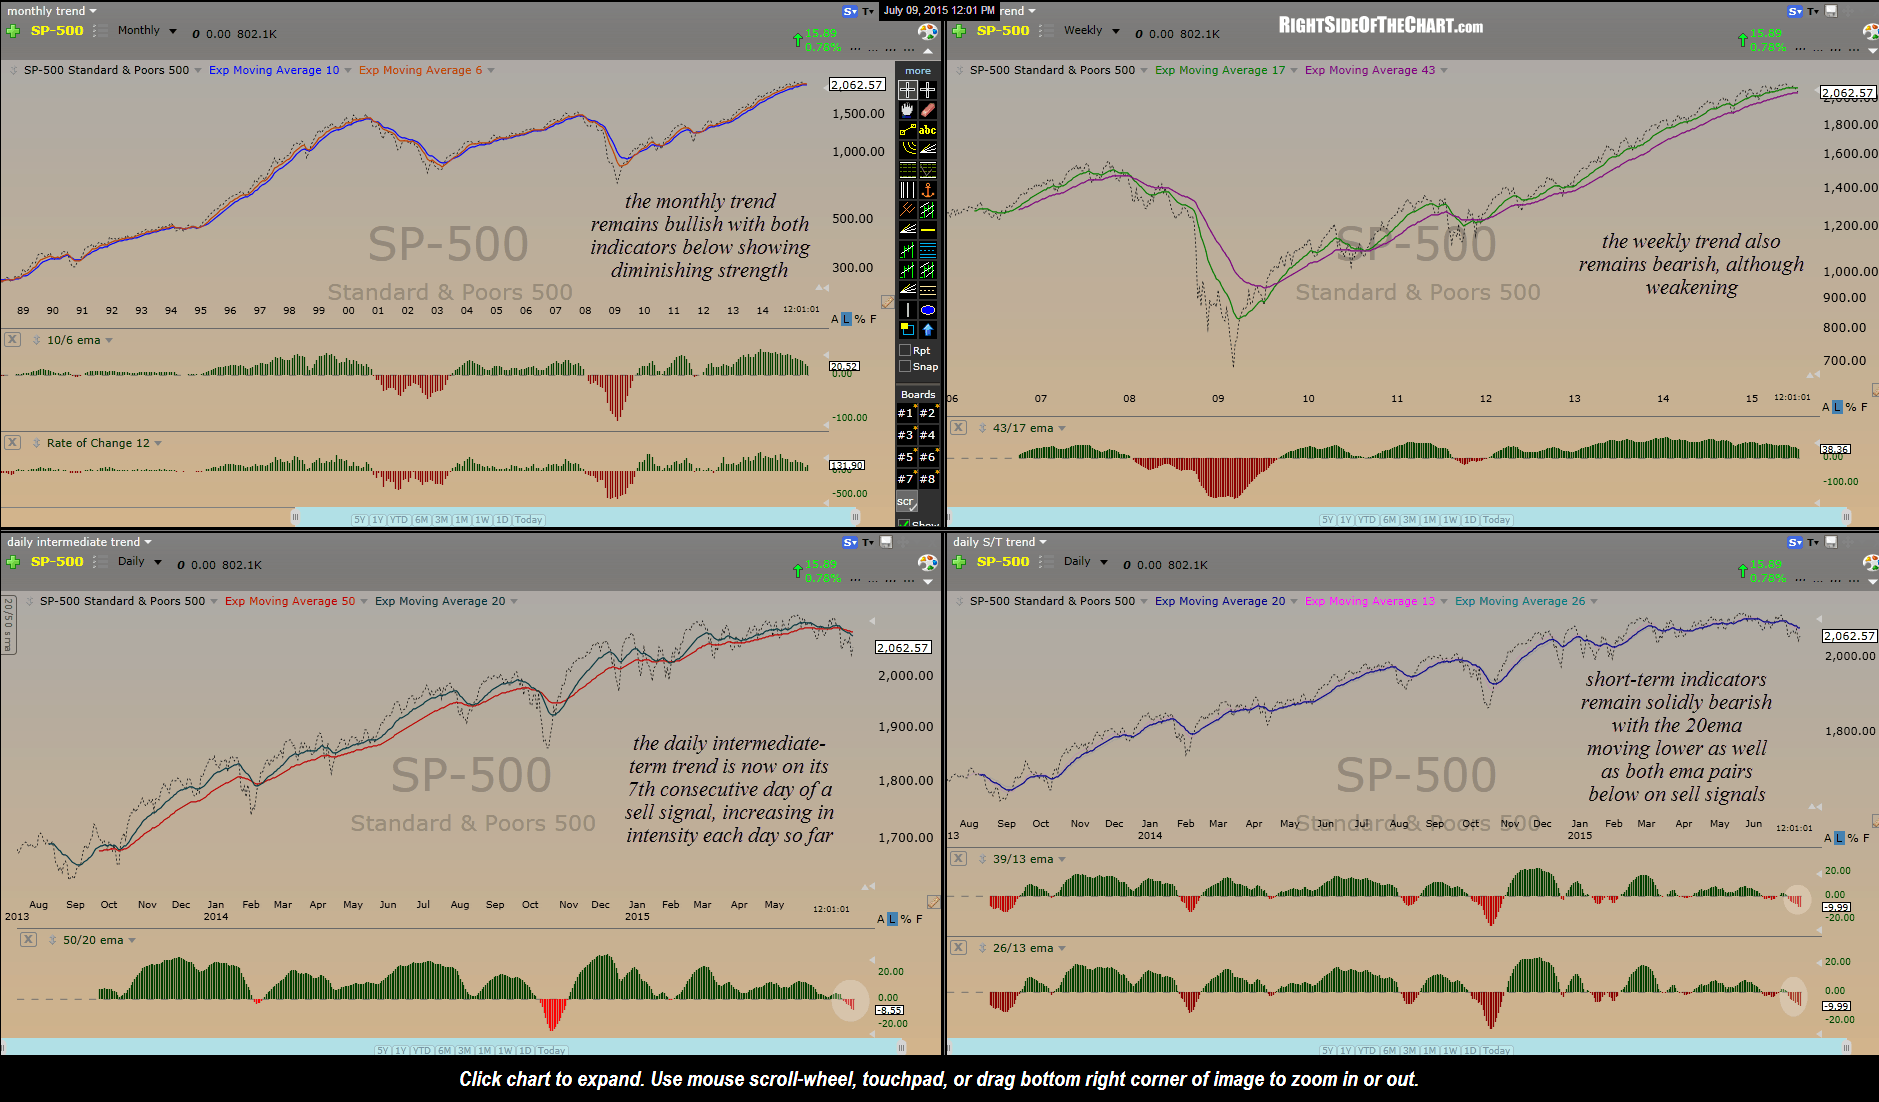
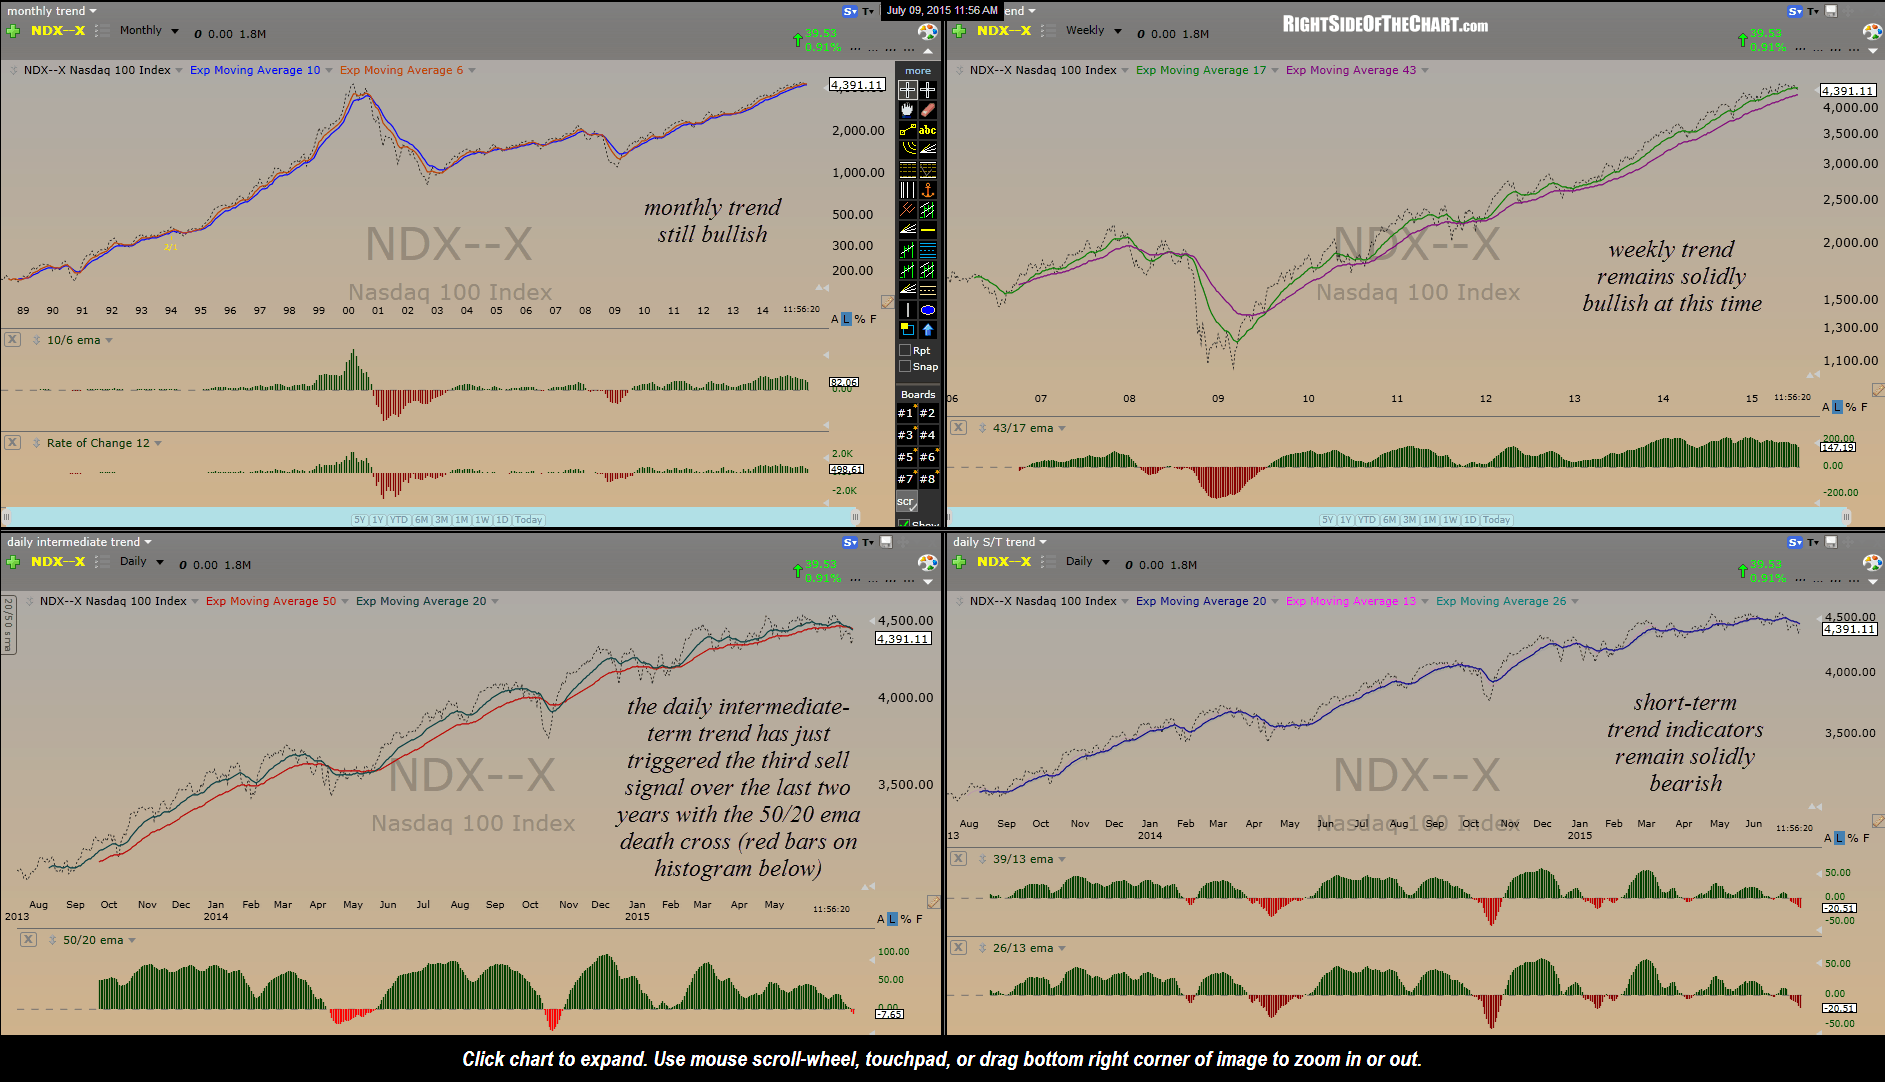
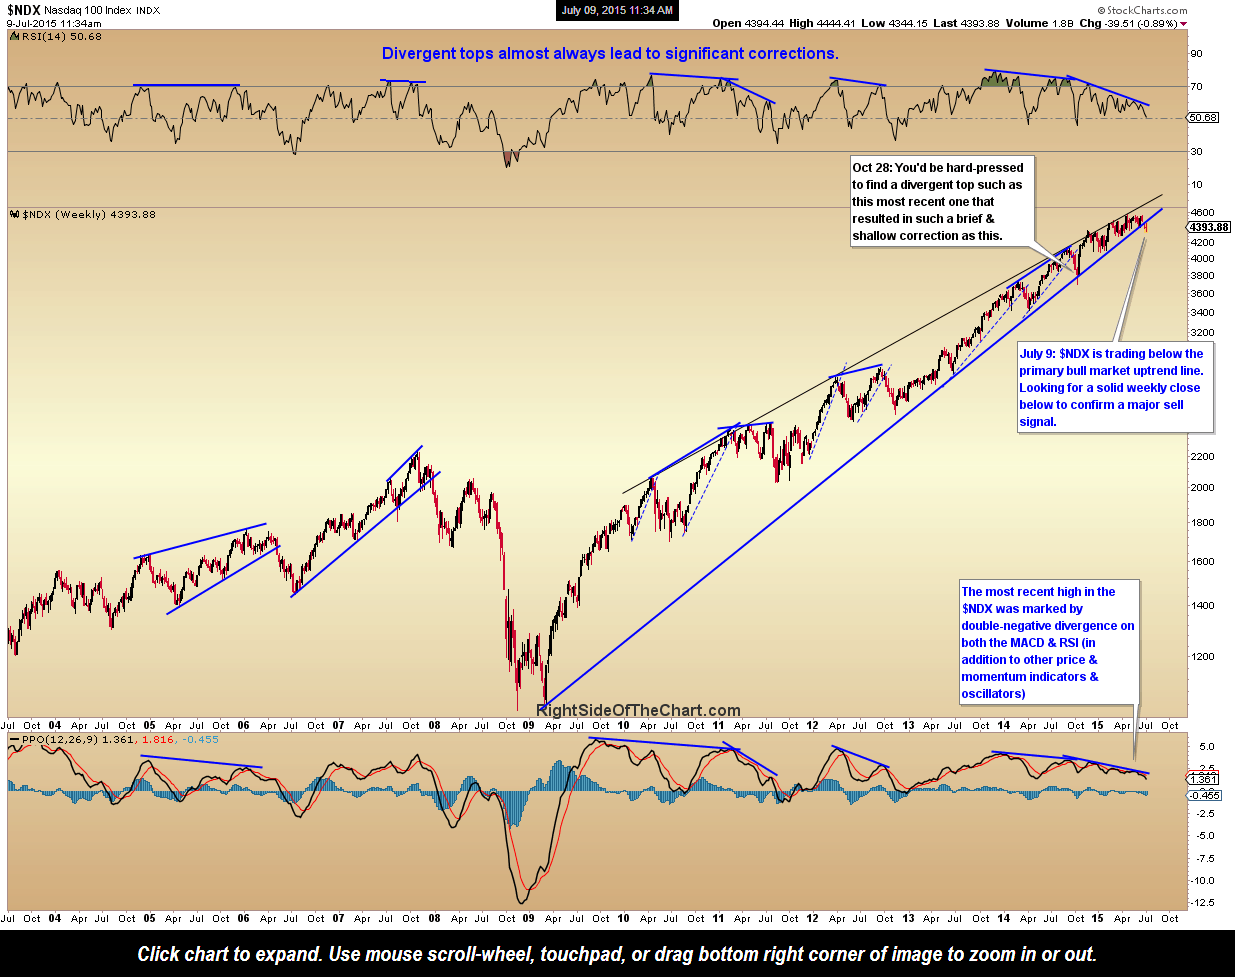
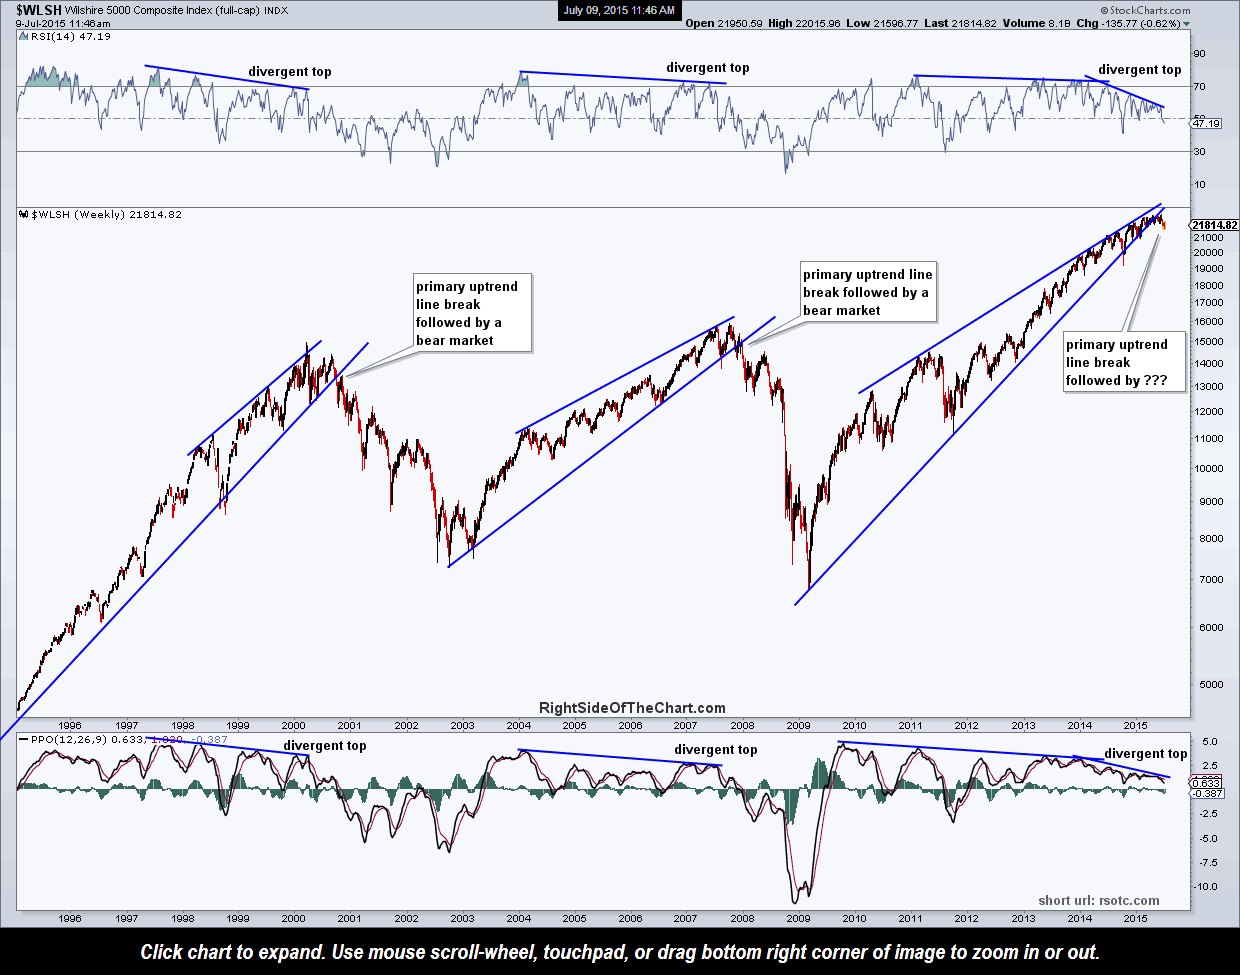
If and when all key US equity indices are clearly trading below their respective primary bull market uptrend lines shown on these weekly charts, the next major sell signal will come on a bearish crossover of the 43/17-week ema pair (on not one, but all major US stock indices).
The 43/17-week ema pair can be found in the upper-right quadrant of the first two charts below. The 50/20-day ema pair has done a fair job of defining the intermediate-term trend historically and can be found in the lower-left quadrant of the first two charts. The histograms at the bottom of each chart provide a visual representation of whether the faster ema in the pair is trading above or below the slower ema, and by how much.
