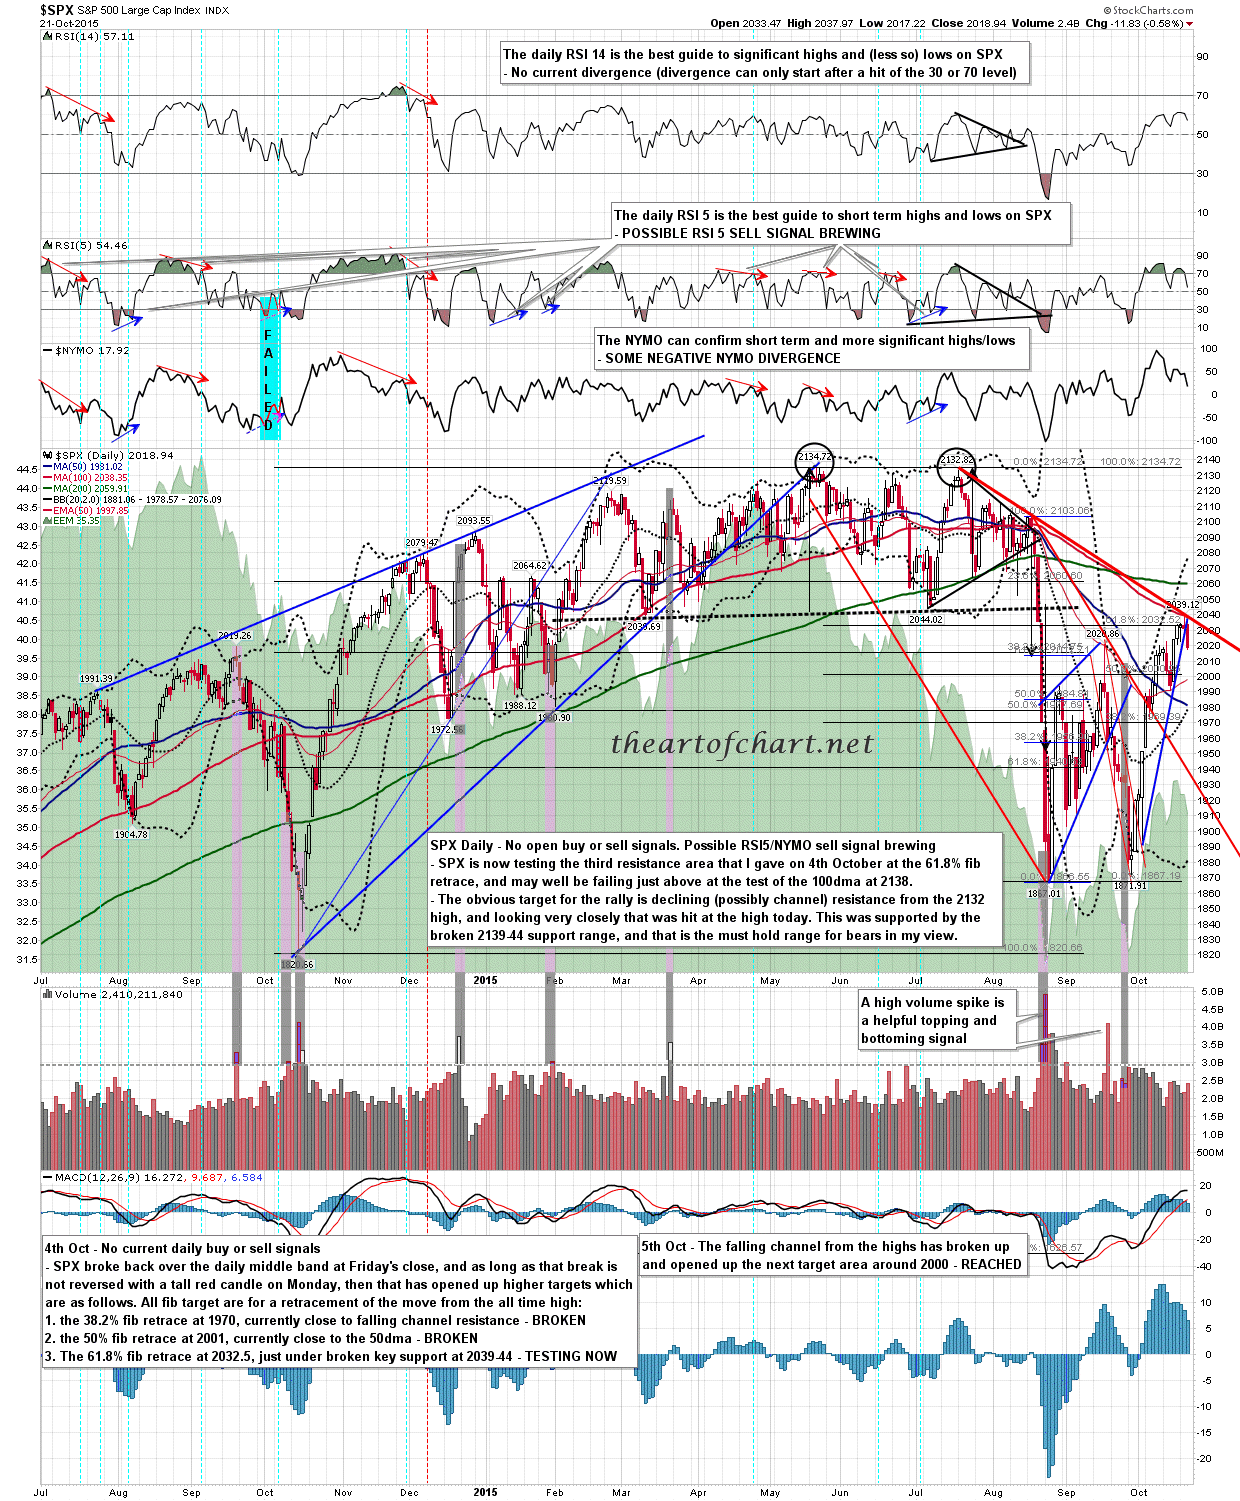
After the close yesterday I had a very careful look at the declining resistance trendline from 2132 using very thin trendlines. The high yesterday tested that trendline twice, and the obvious rally target has therefore been hit. Looking at NDX and RUT there are quality trendline highs on all three indices, with a daily RSI 5 sell signal now fixed on RUT, and close to an RSI5_NYMO sell signal on SPX. If this has just been a rally, which seems very likely, the top should now be in. Even in the event that this hasn’t been a rally the short term high should now be in, though in the latter case the resistance trendlines established yesterday would obviously be less strong.
SPX has tested declining resistance from 2132 and reversed there so far. There is no clear overall pattern on SPX but that trendline is one half of the overall pattern that should become apparent later. SPX daily chart: