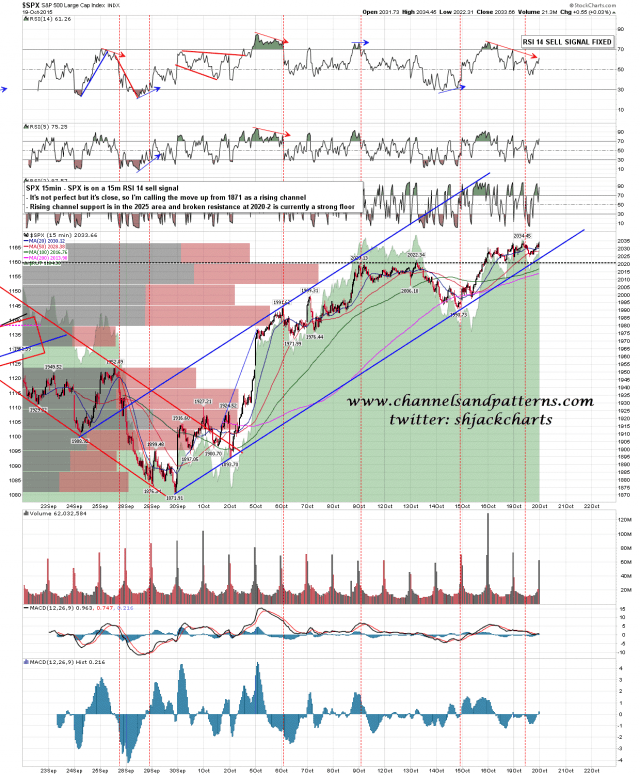
A 15min sell signal fixed on SPX yesterday and at the close yesterday there were fixed sell signals on the 60min and 15min RSI 14s on all of the SPX, NDX and RUT charts. There was a similar, though weaker, setup back down at 1870 when this rally started, which was a major warning signal of reversal.
On SPX there is a near perfect rising channel so I’m calling the SPX pattern as that channel. Channel support is in the 2025 area and support at broken resistance in the 2020-2 area is a solid floor until SPX can sustain a move below it. There isn’t anything really going on the short side here until that happens. SPX 15min chart:
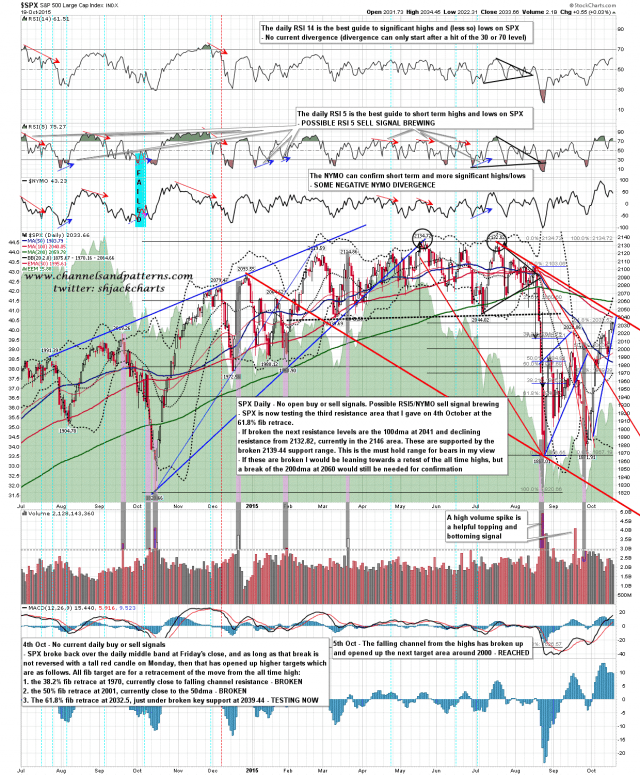
If we do see a break down then there is a very nicely formed daily RSI5_NYMO sell signal forming here, These are very reliable signals and if we see that signal fix I’d be looking for an absolute minimum move to retest 1970 or 1950. For that to fix though we would need a few days of trading sideways or a one solid red day. SPX daily chart:
As long as 2020-2 remains a floor I’m looking at declining resistance (from 2132) in the 2046 area as the obvious target for that move. If we are going to see that target hit today then I’d be looking for an AM low that fails into dip buying.


