
It’s hard to develop a pattern structure without meaningful retracements. I have a perfect rising channel on NDX, but am looking skeptically at my best support trendline prospect on SPX, which would currently require a retracement to the 1950 area to confirm channel support. That’s an improvement on RUT where I don’t currently have any decent prospects at all for a support trendline. We should see a retracement soon to define these support trendlines and I’m surprised that equities managed to build up negative divergence for the majority of last week without that forcing a retracement.
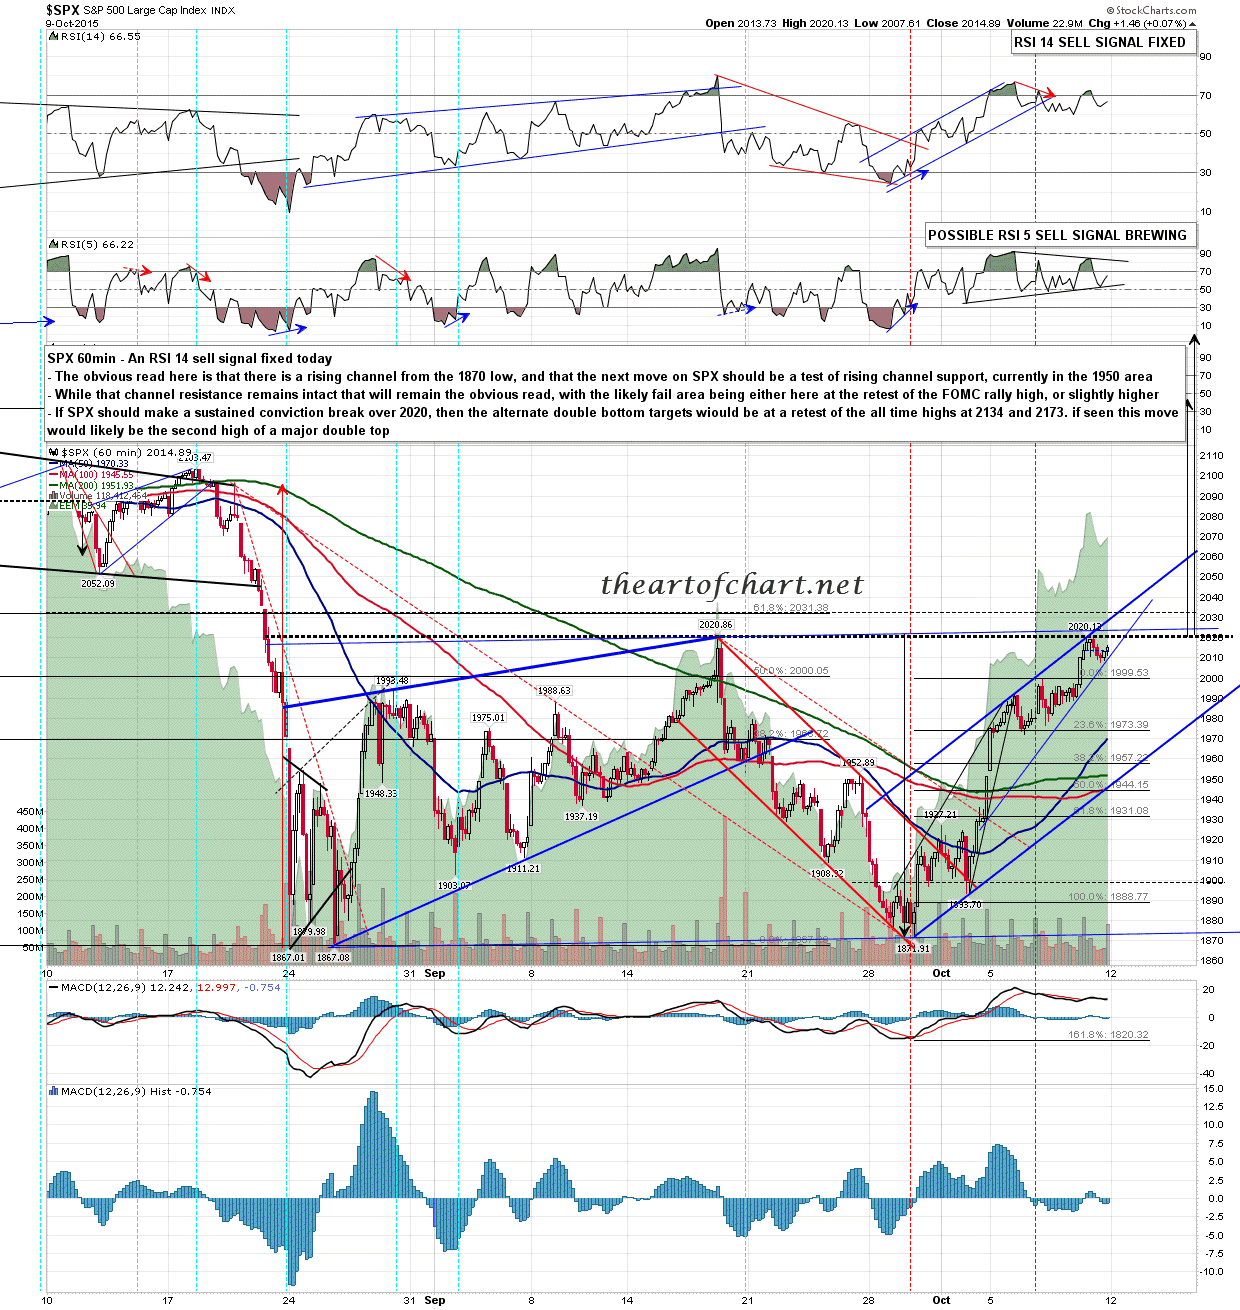
SPX is still on hourly and 15min RSI 14 sell signals, and my best prospect for an SPX pattern here is shown below. SPX 60min chart:
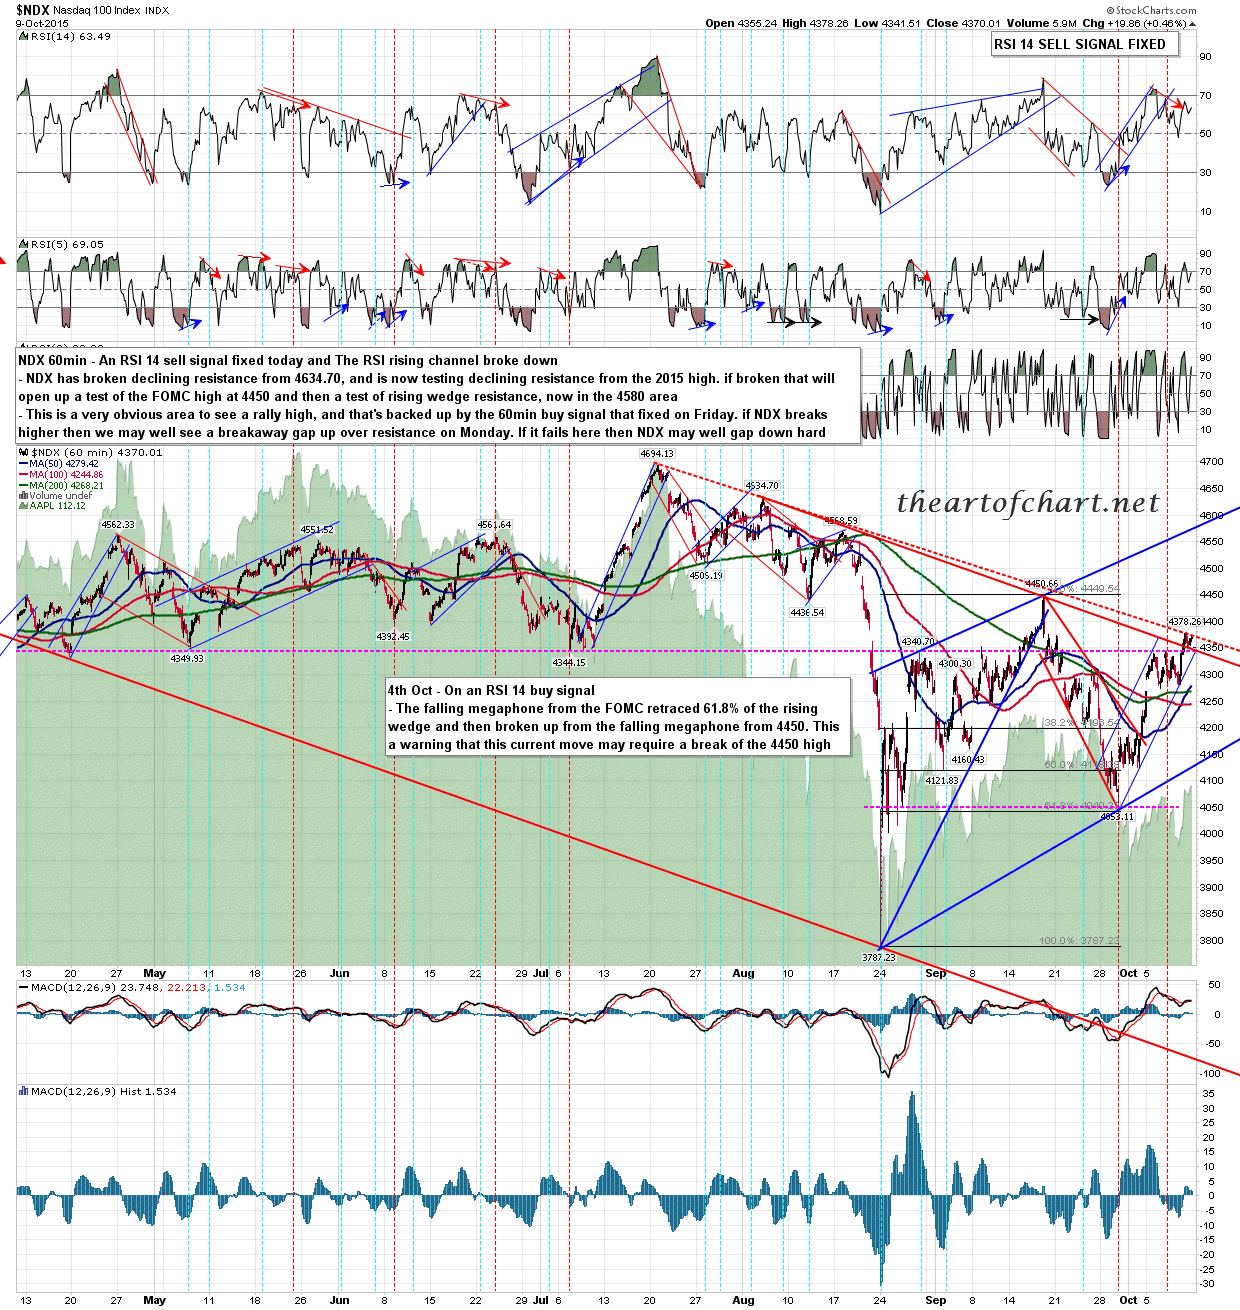
NDX is on an hourly RSI 14 sell signal too now as that fixed on Friday afternoon. Interestingly the high on Friday was also a precise test of declining resistance from the 2015 high, and that’s holding so far. NDX 60min chart:
The short term pattern pathway is a thrust from a triangle, followed by a full retracement of the triangle thrust into the 1995 area. The triangle thrust wasn’t showing much in the way of signs of life on Friday, and unless that changes this morning I’ll be looking for that retracement into the 1995 area, and would note that is a close match with the weekly pivot on ES which I have at 1186 (ES). If that triangle thrust is still AWOL this morning we’ll most likely at the least see that retracement today or tomorrow.
