
SPX has reached my 2025 target and broken it slightly, with the rally high at 2030.70 as I write this. Is this the rally high? Well the rising wedge on NQ says that it should be. I posted this wedge yesterday morning and since then NQ has hit wedge resistance, done a small bearish overthrow, and a 60min RSI 14 sell signal has fixed. The high probability outcome for NQ here is that the next move breaks wedge support in the 4365 area and then does at minimum a 38.2% fib retracement of the wedge into the 4280 area. Once NQ has managed that I’d be expecting to see it go a lot lower. NQ 60min chart:
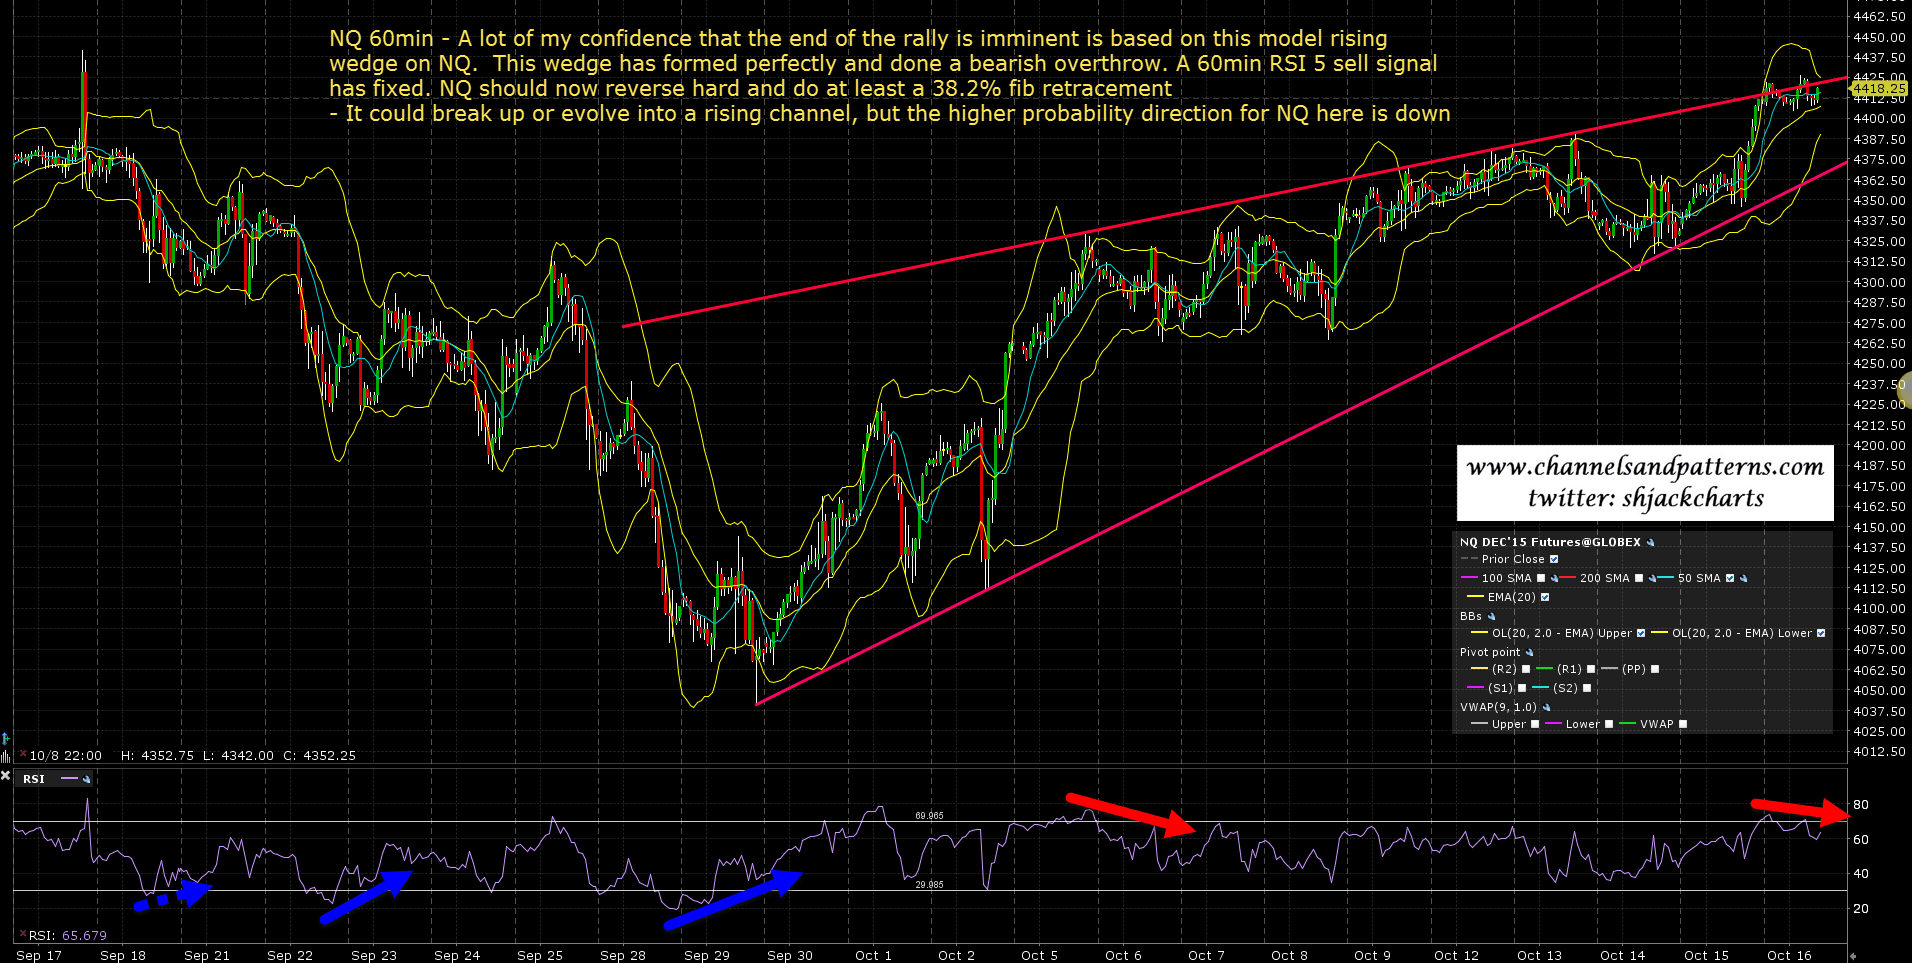
If the NQ wedge doesn’t deliver and SPX pushes much over 2030 then the chances that we will see a retest of the all time high increase considerably, though there would still be two very important resistance areas to watch on the daily chart.
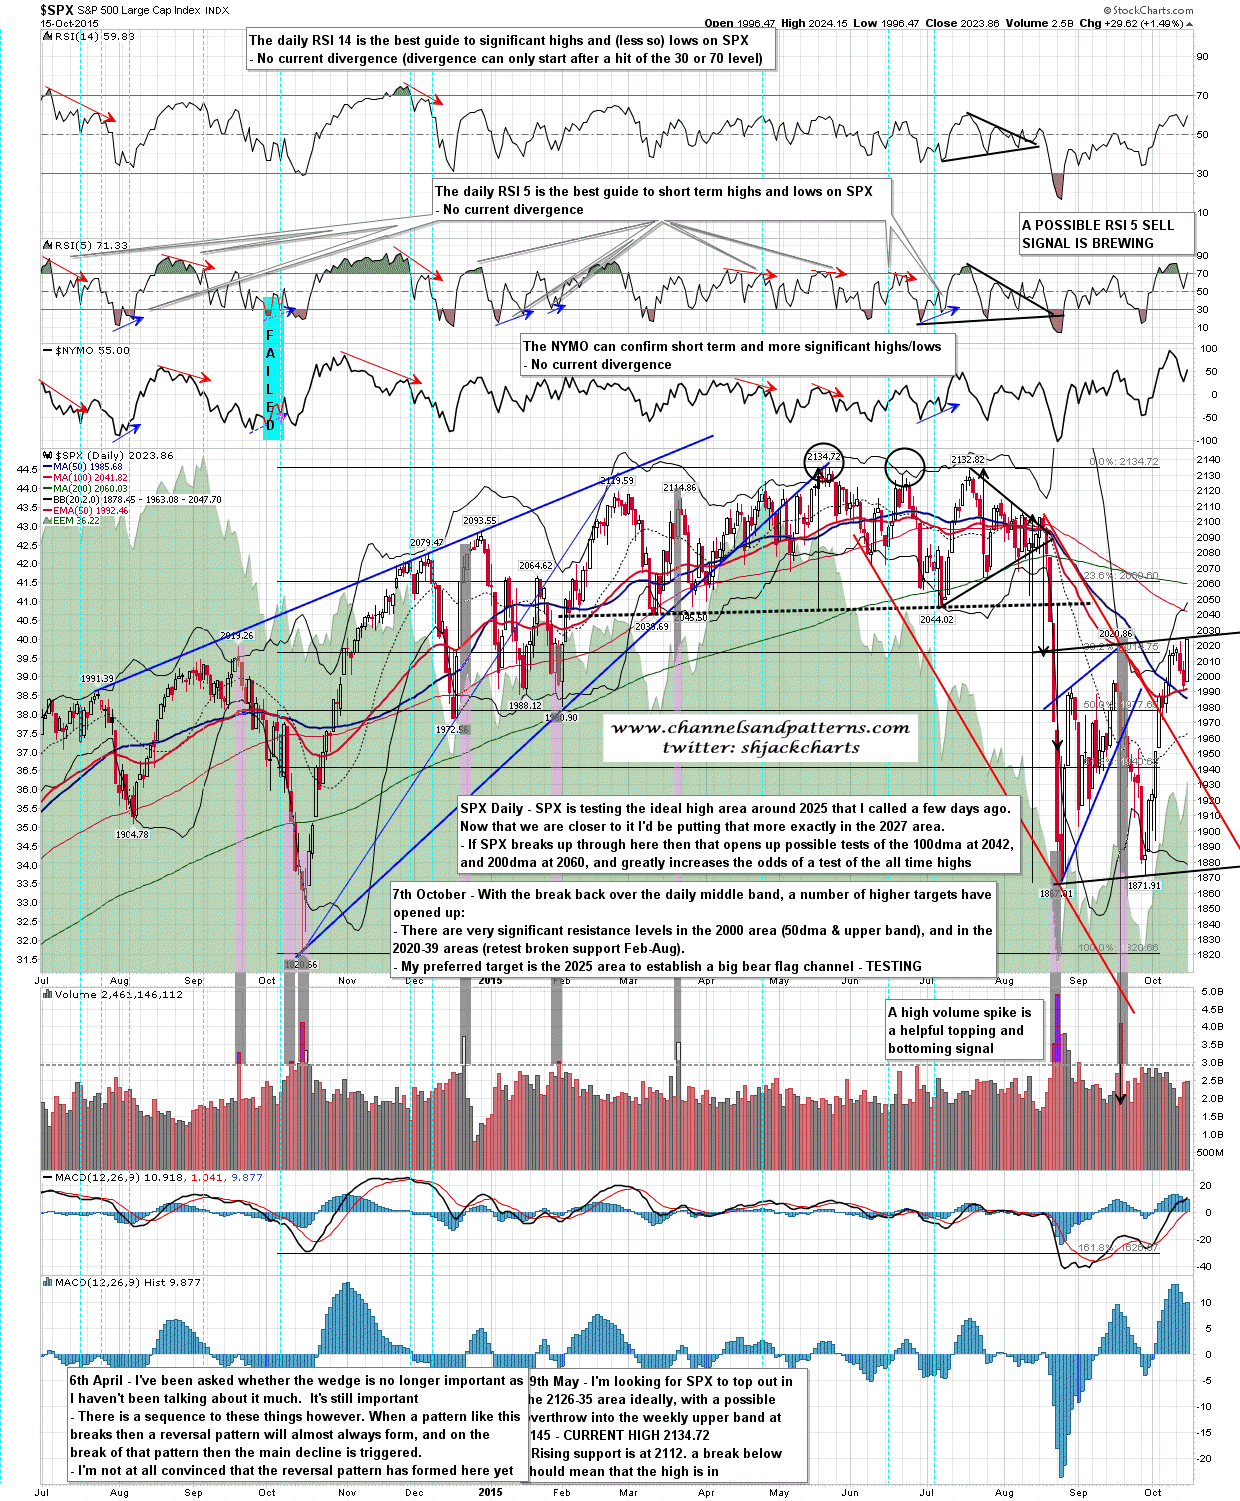
The first area would be broken support in the 2039-44 range, supported by the 100dma at 2040 and the weekly middle band at 2037. As it is Friday the weekly middle band should be solid resistance.
The second area is the 200dma, currently at 2060, and a match with a retest of main broken rising channel support from 2012. SPX daily chart:
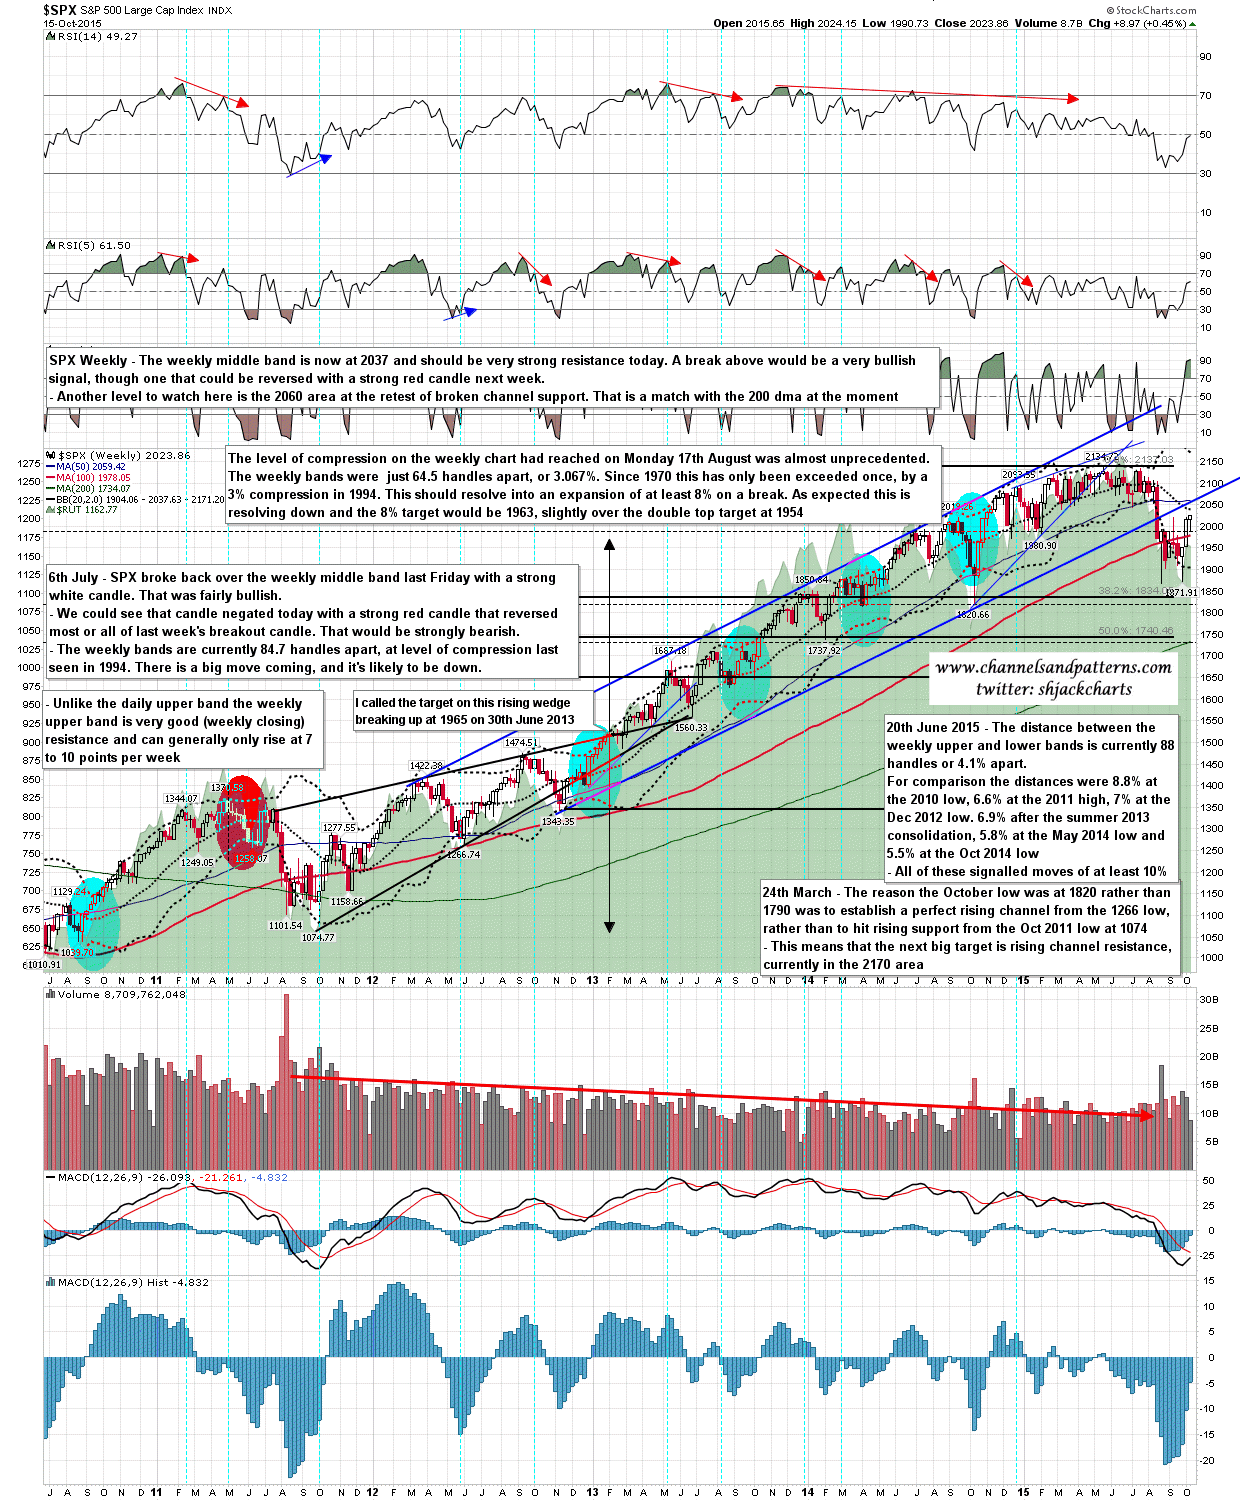
SPX weekly chart:
On the bear scenario the high for today was most likely made at the open. NQ is significantly underperforming ES/SPX so far today and the rising wedge scenario there is looking fine so far. We will see how that goes today. I would say though that so far at least there is no sign of rejection at these levels. I’m hoping those signs appear soon. If the opening high is broken that would not be encouraging for bears here.
