
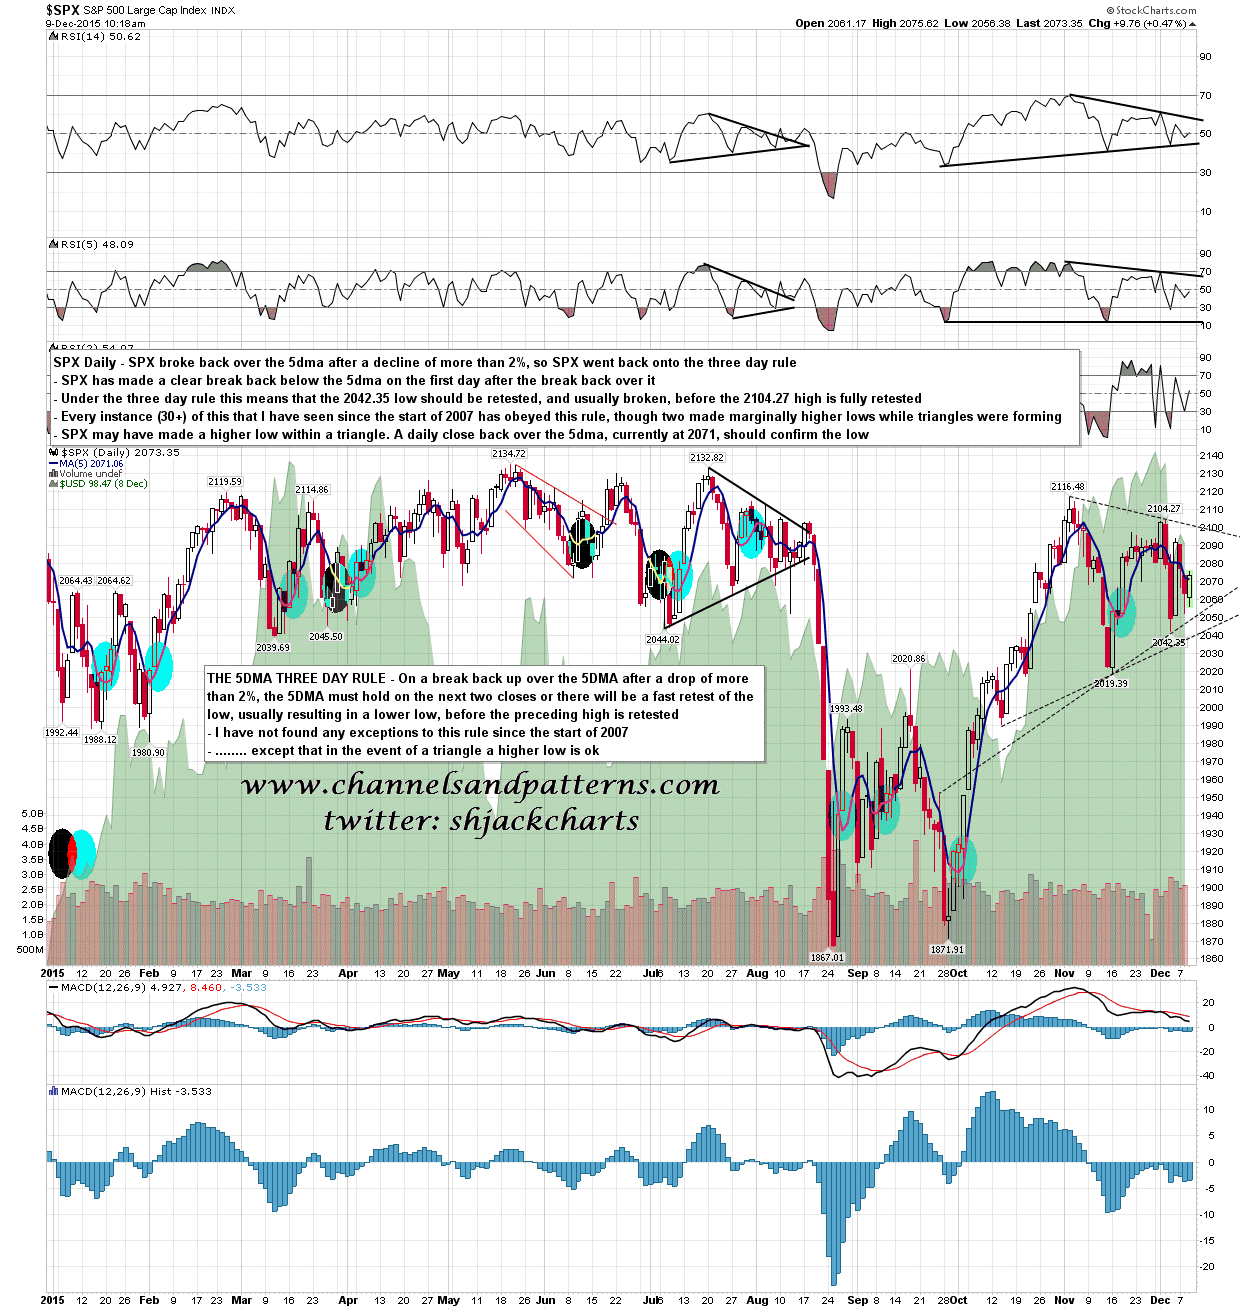
The target on the 5dma rule is a full retest of the last low at 2042, and most likely a lower low. There is an exception though in rare cases where a triangle is forming, and we may well have that happening here. A daily close back over the 5dma, now in the 2071 area, should confirm the low. SPX daily 5dma chart:
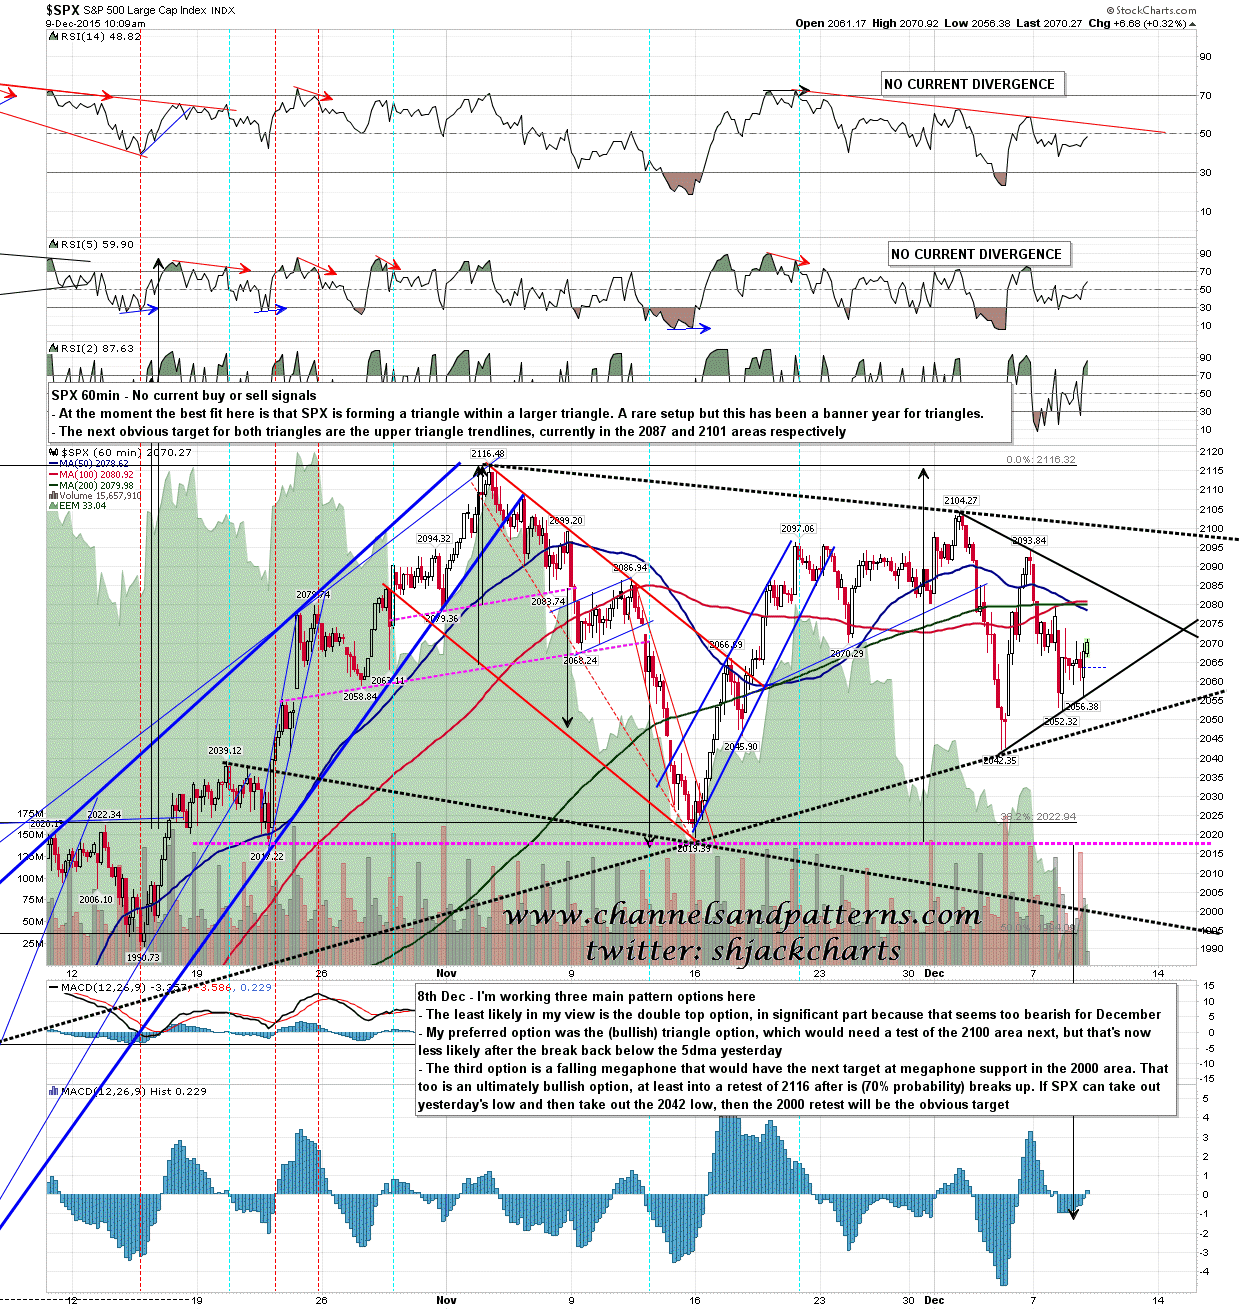
Looking at the 60min chart I think there may be two triangles in play here, which is very unusual, though this has been a banner year for triangles. I have the triangle resistance levels in the 2087 and 2101 areas respectively. SPX 60min chart:
A late post today and SPX has been very busy in the first hour. Today is a cycle trend day so there are 70% odds that either buyers or sellers will dominate the day. That does not require a full trend day. I’m hoping that most of you caught my tweets before the open calling the cycle trend day and possible early low without making the full 5dma Three Day Rule Target.
