
After a wild opening spike SPX returned and broke my main triangle option and last Thursday’s low, which was the full 5dma Three Day Rule target. I think that makes about three dozen of these 5dma breaks that have all made target since the start of 2007, with the only exceptions being two slightly higher lows when triangles were forming earlier this year. There will come a time when this stat doesn’t deliver of course, as no stat can ever be perfect, but this was not that time. SPX daily 5dma chart:
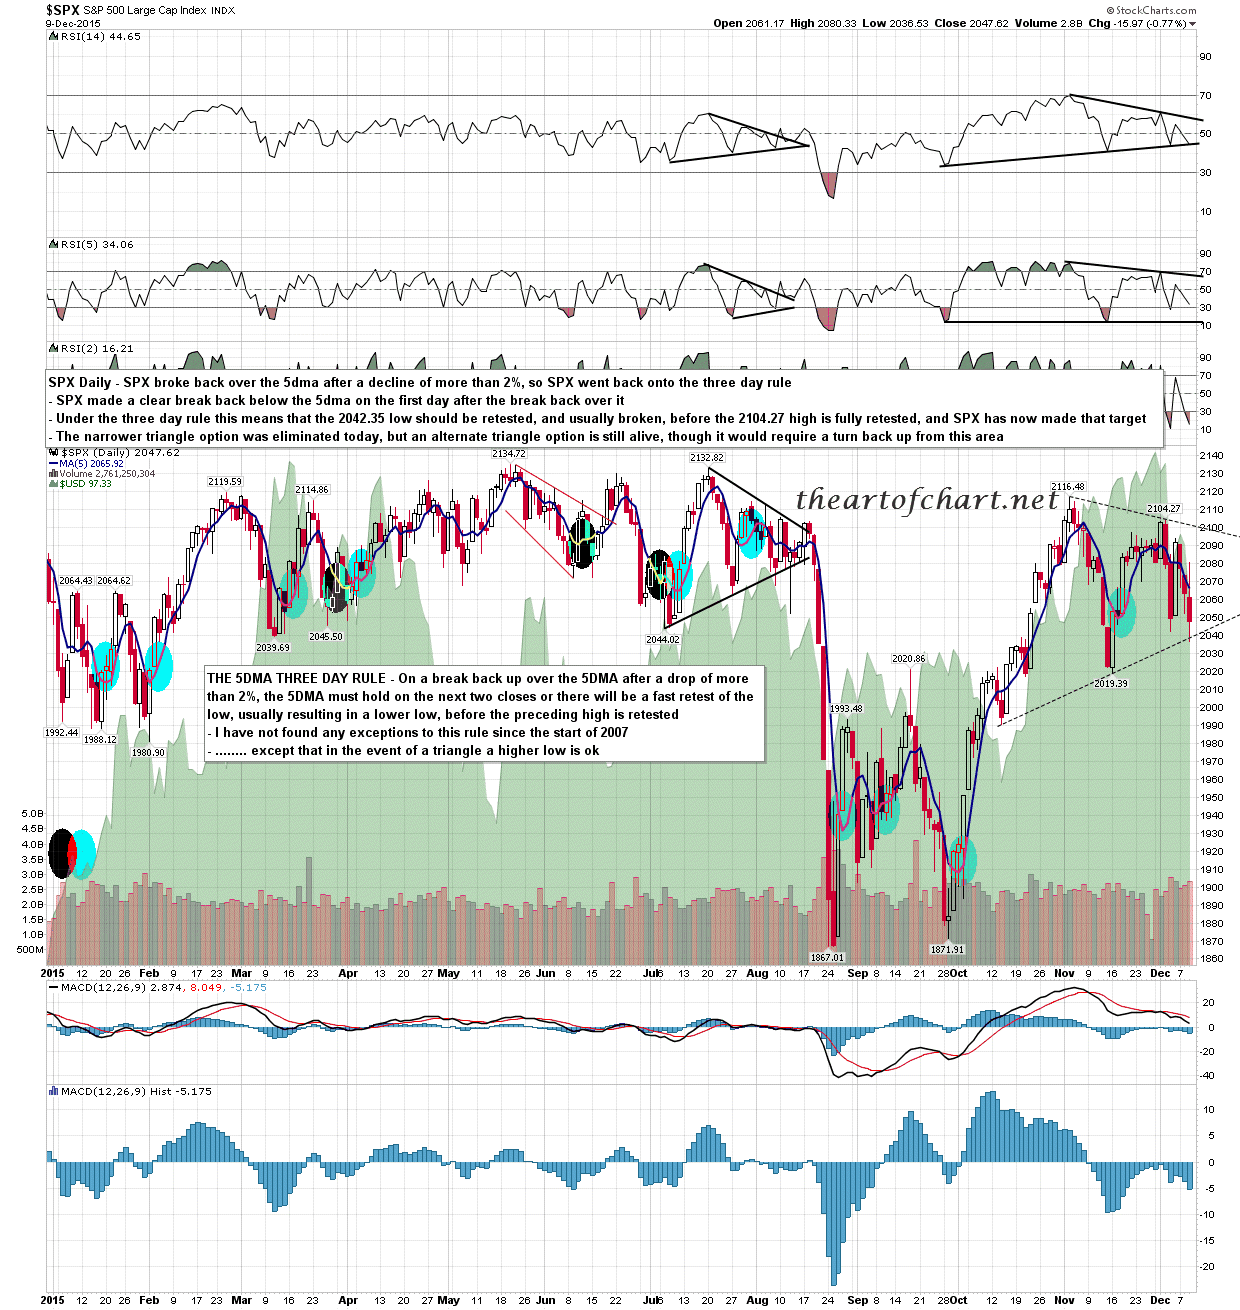
So now what? Well the low yesterday took out my preferred triangle option on SPX but has left an alternate still in play. That could still hold and if so would require a reversal back up past 2065-70 area resistance towards the next target at triangle resistance in the 2100 area. I think however that the odds are now favoring a break down towards a retest of 2000 at falling megaphone support. This would be a likely bull flag on the bigger picture of course. SPX 60min chart:

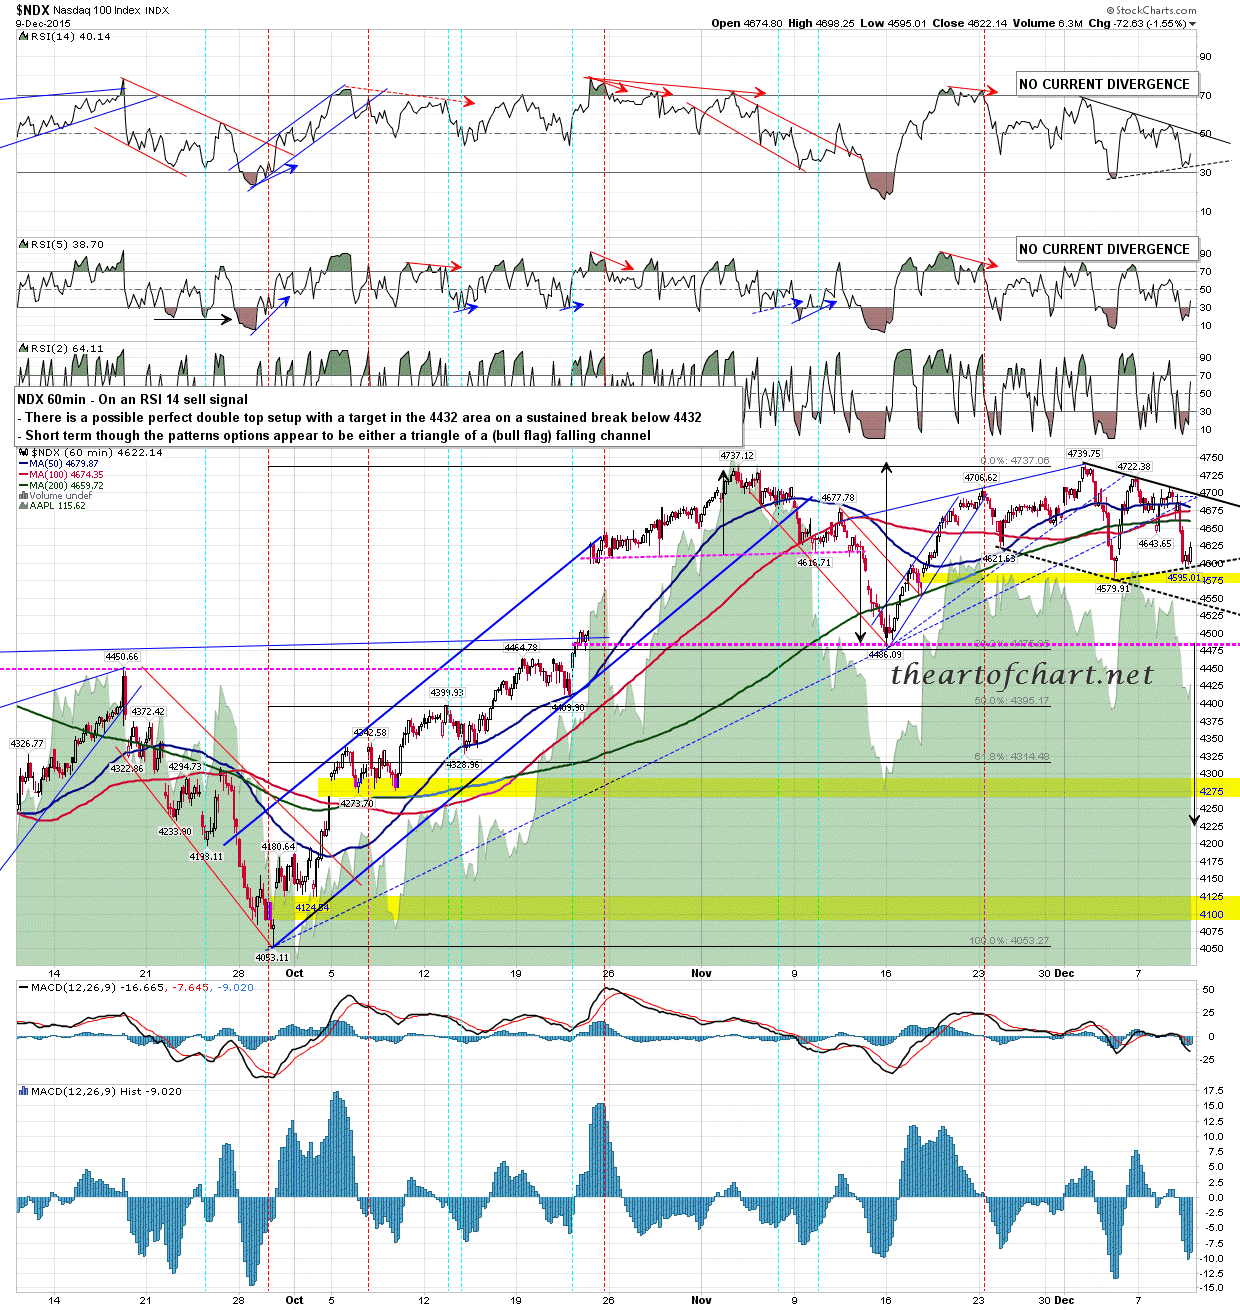
The setup looks strikingly similar on NDX, with the triangle and bull flag options, albeit a flag falling channel in this case. NDX 60min chart:
The one I’ll be watching very closely today though is RUT, with a decent looking falling wedge from the high on there. There is a strong wedge resistance trendline there, currently in the 1158 area, and it that should break up that would be an impressively bullish break that might well signal that the equity indices are going with the lower probability triangle option. RUT 60min chart:

Some of you will have been at the open to all Chart Chat at theartofchart,net on Sunday or have watched the recording since. We were looking at ES/SPX, NQ/NDX, TF/RUT, USD, oil, natural gas, gold, silver, GDX, and sugar and a couple of other trading instruments. If you watch the recording again today I think you will be struck with how well we predicted this week so far. You can see that recording here.
We’ve been trying to fit in a free webinar every Thursday on a variety of TA subjects and are doing two free to all webinars tonight. The first, led by Stan, is ‘Elliot Wave and Retracement Patterns’ at 4pm EST and you can signup for that here. The second, led by me, is ‘Trending Patterns and how to trade them’ at 5pm EST and you can sign up for that here. We’ll be discussing the action today and what we are looking for next in these webinars as well so they should be well worth attending.
Our last free to all webinar for 2015 will be next Thursday, 17th Dec, at 4pm EST, and that will be ‘Holiday Special Chart Chat – the Long Term View for 2016’, and you can sign up for that here.
Today is the other cycle trend day this week. That means that either buyers or sellers are likely to dominate the day. It does not require a full trend day.
