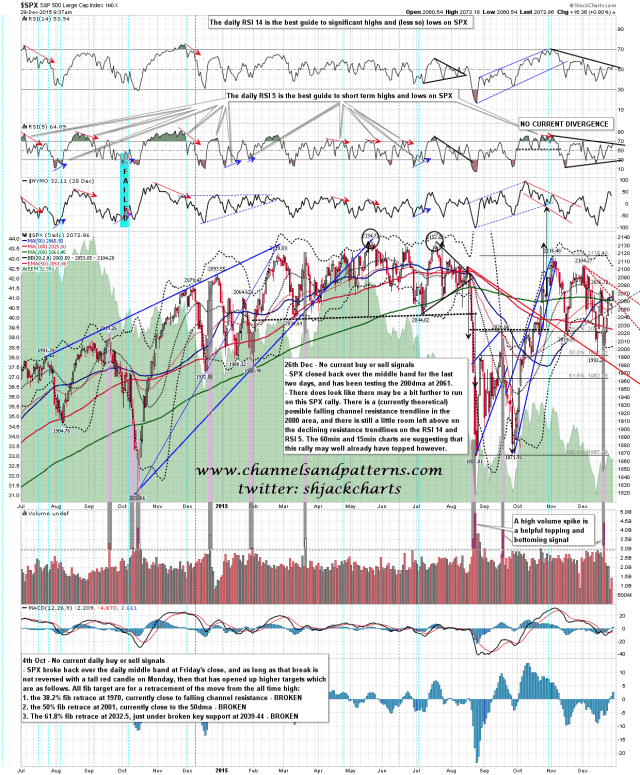
Only one chart today and it is the main chart that I am watching on SPX. I did the chart on Saturday for Chart Package subscribers at theartofchart.net, and we are now close to the possible falling channel resistance test that I was looking at then. I have that in the 2078 area. If that resistance holds then we will most likely see a big decline start there, though the decline would most likely not get serious before the end of the year. SPX daily chart:
If we see SPX break over 2080 and hold it, then the upside opens up and we could see a test of 2100, but I’d be surprised to see that here. I’ve been surprised before though and seasonality is strongly bullish into tomorrow’s close.
Just a reminder that Stan and I are doing a free to all Chart Chat on Sunday at theartofchart.net. If you are at all interested in where prices are likely to be going on all main indices, bonds, forex or commodities then I’d consider attending. You can sign up for that here. If you aren’t interested in any of those things then I’m not sure why you are reading this post, though if you are just here for the fine charting and subtle humor then there should be both of those available on Sunday too. 🙂


