
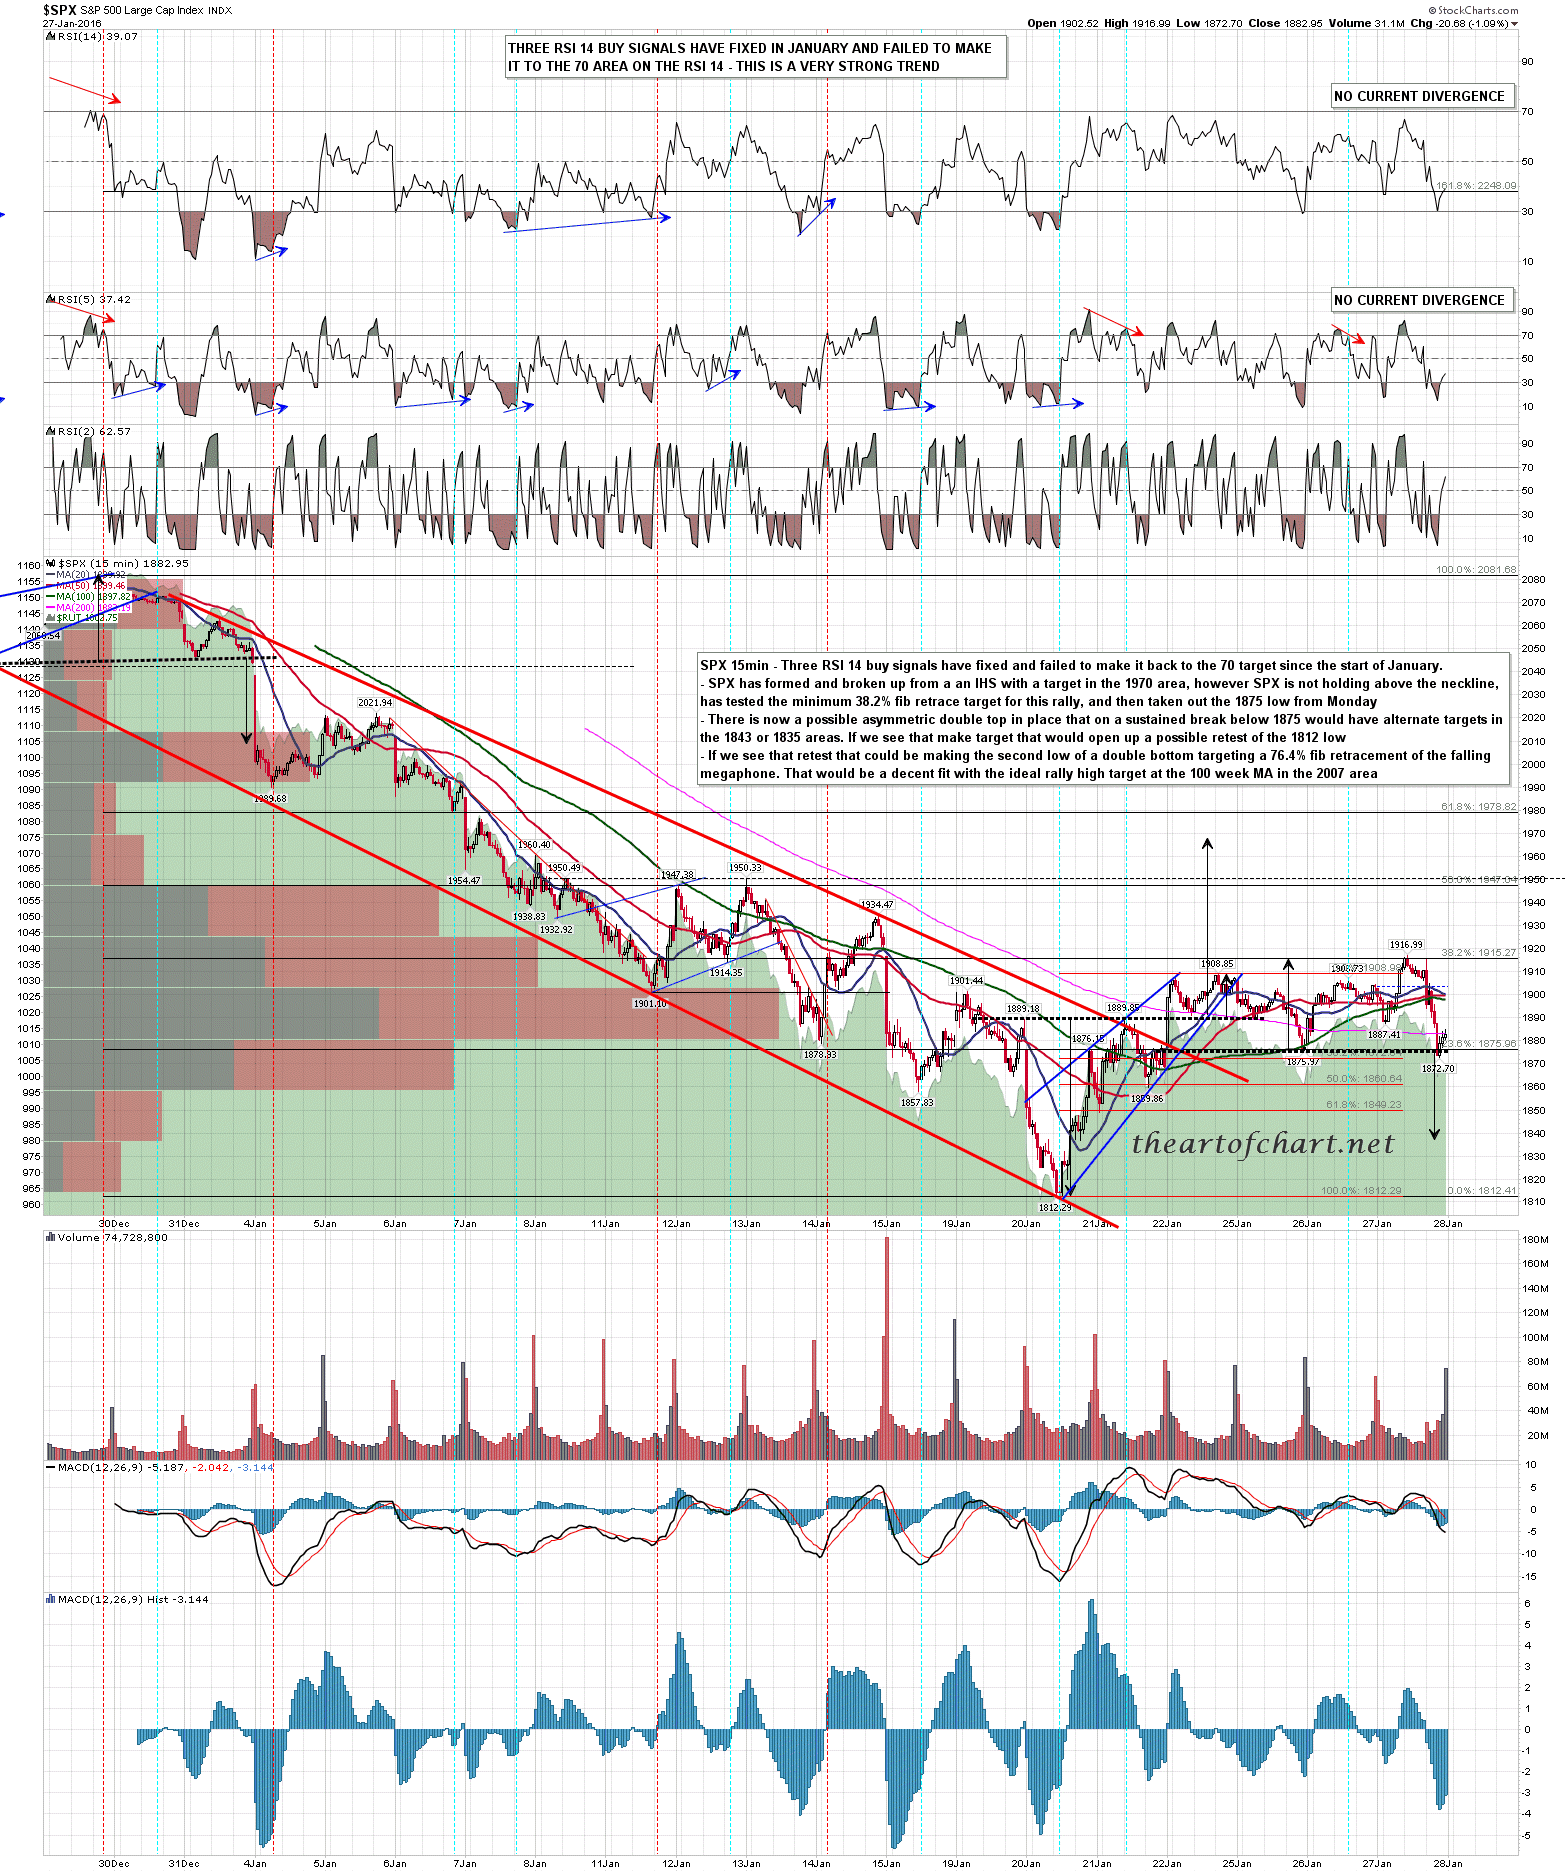
It’s unfortunate that my post is late today. I was working late on theartofchart.net chart deliveries and overslept. I’ll post the 15min charts that I did on SPX, NDX and RUT, and what I was wondering as I did these was whether the rally had just ended on SPX with that FOMC spike that failed. The key support areas I am watching today are the 50 hour MA at 1884 and the ES weekly pivot at 1868 (approx 1875 SPX). If bears can break these and convert them to resistance then we may well be on the way back to test the low at 1812 SPX. SPX 15min chart:
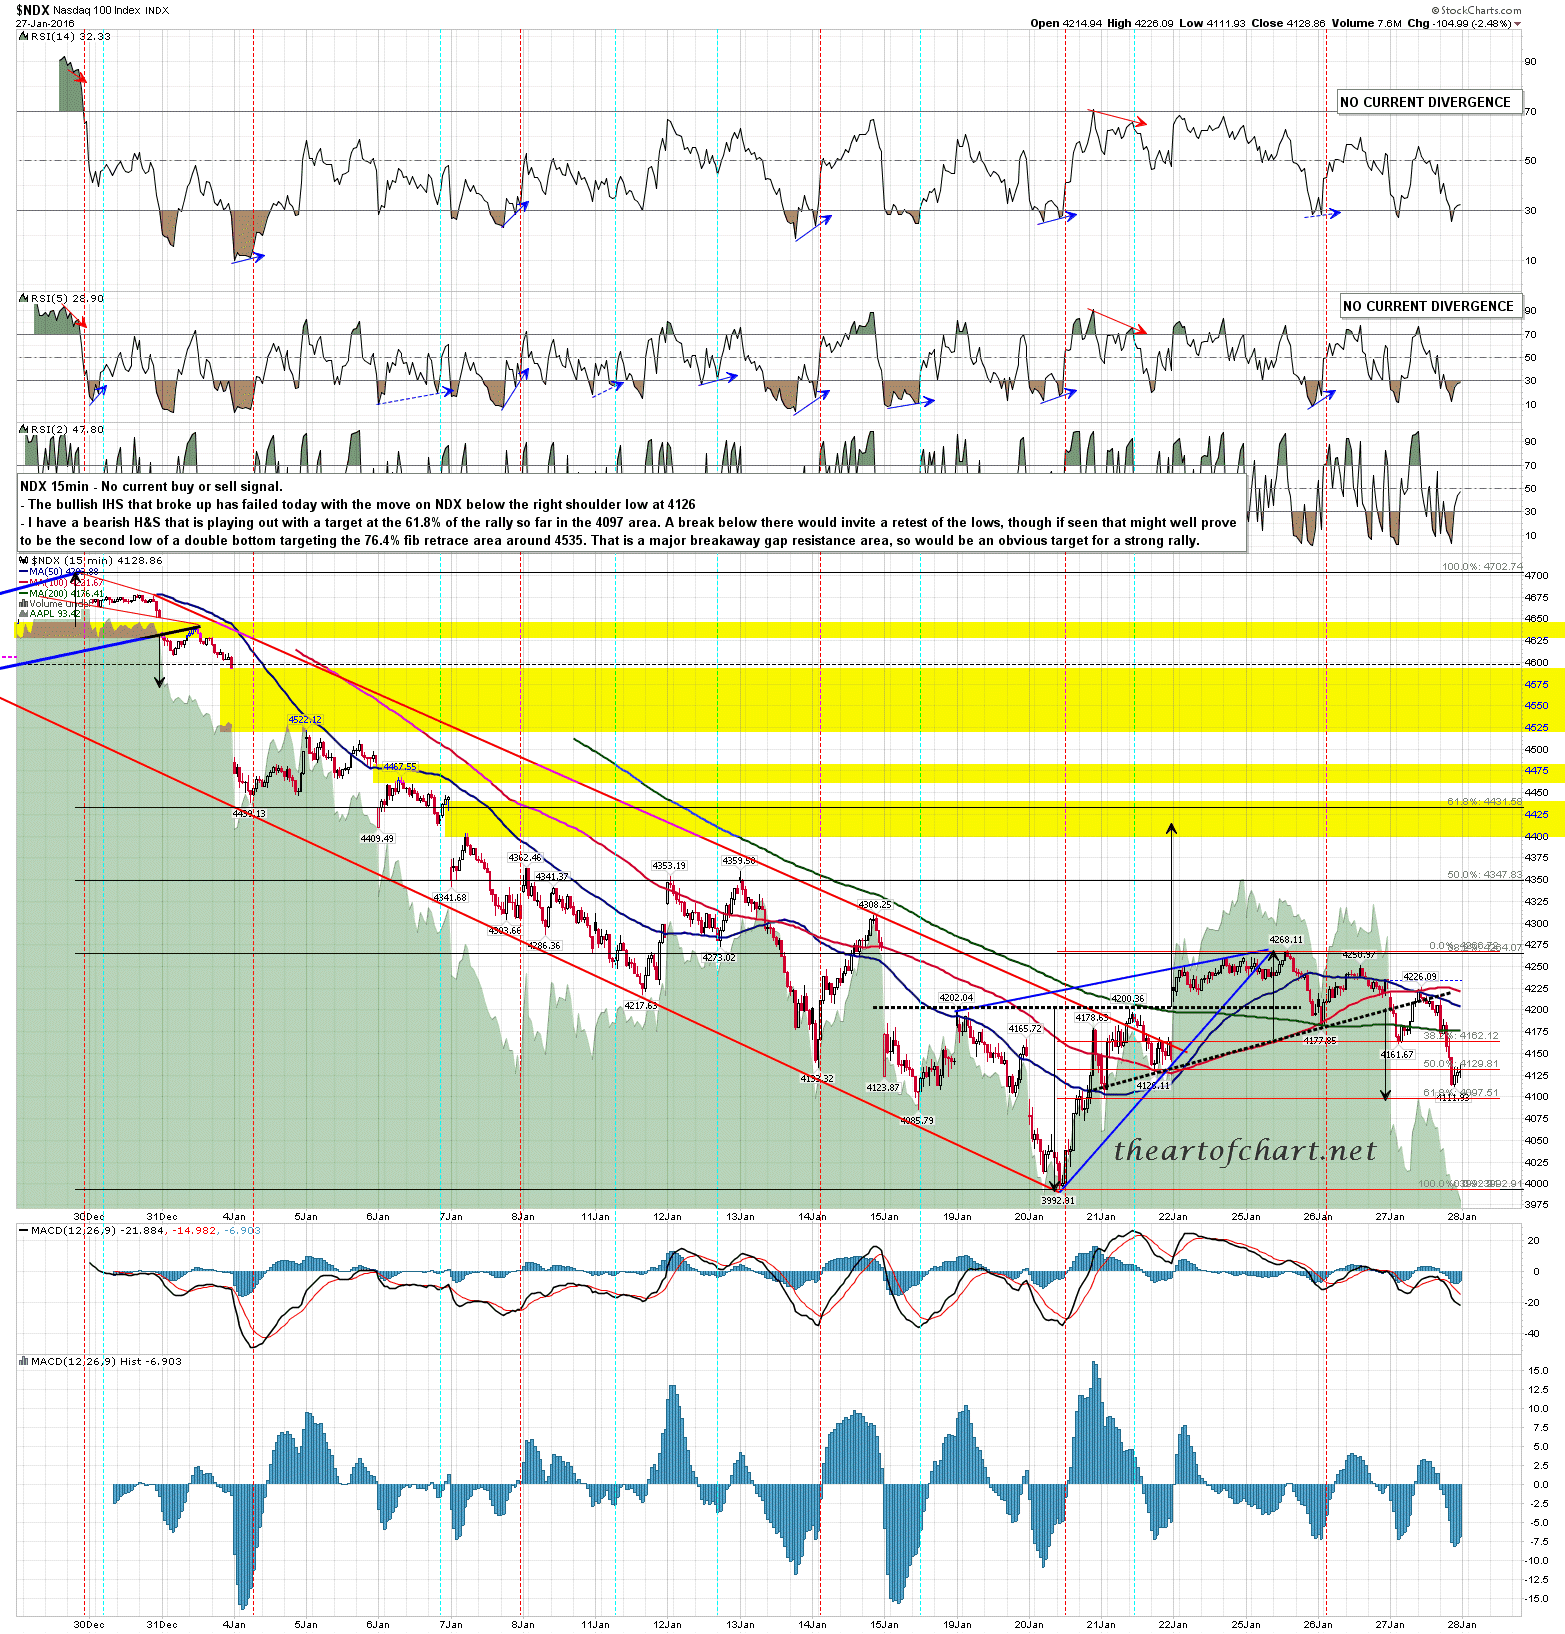
NDX 15min chart:
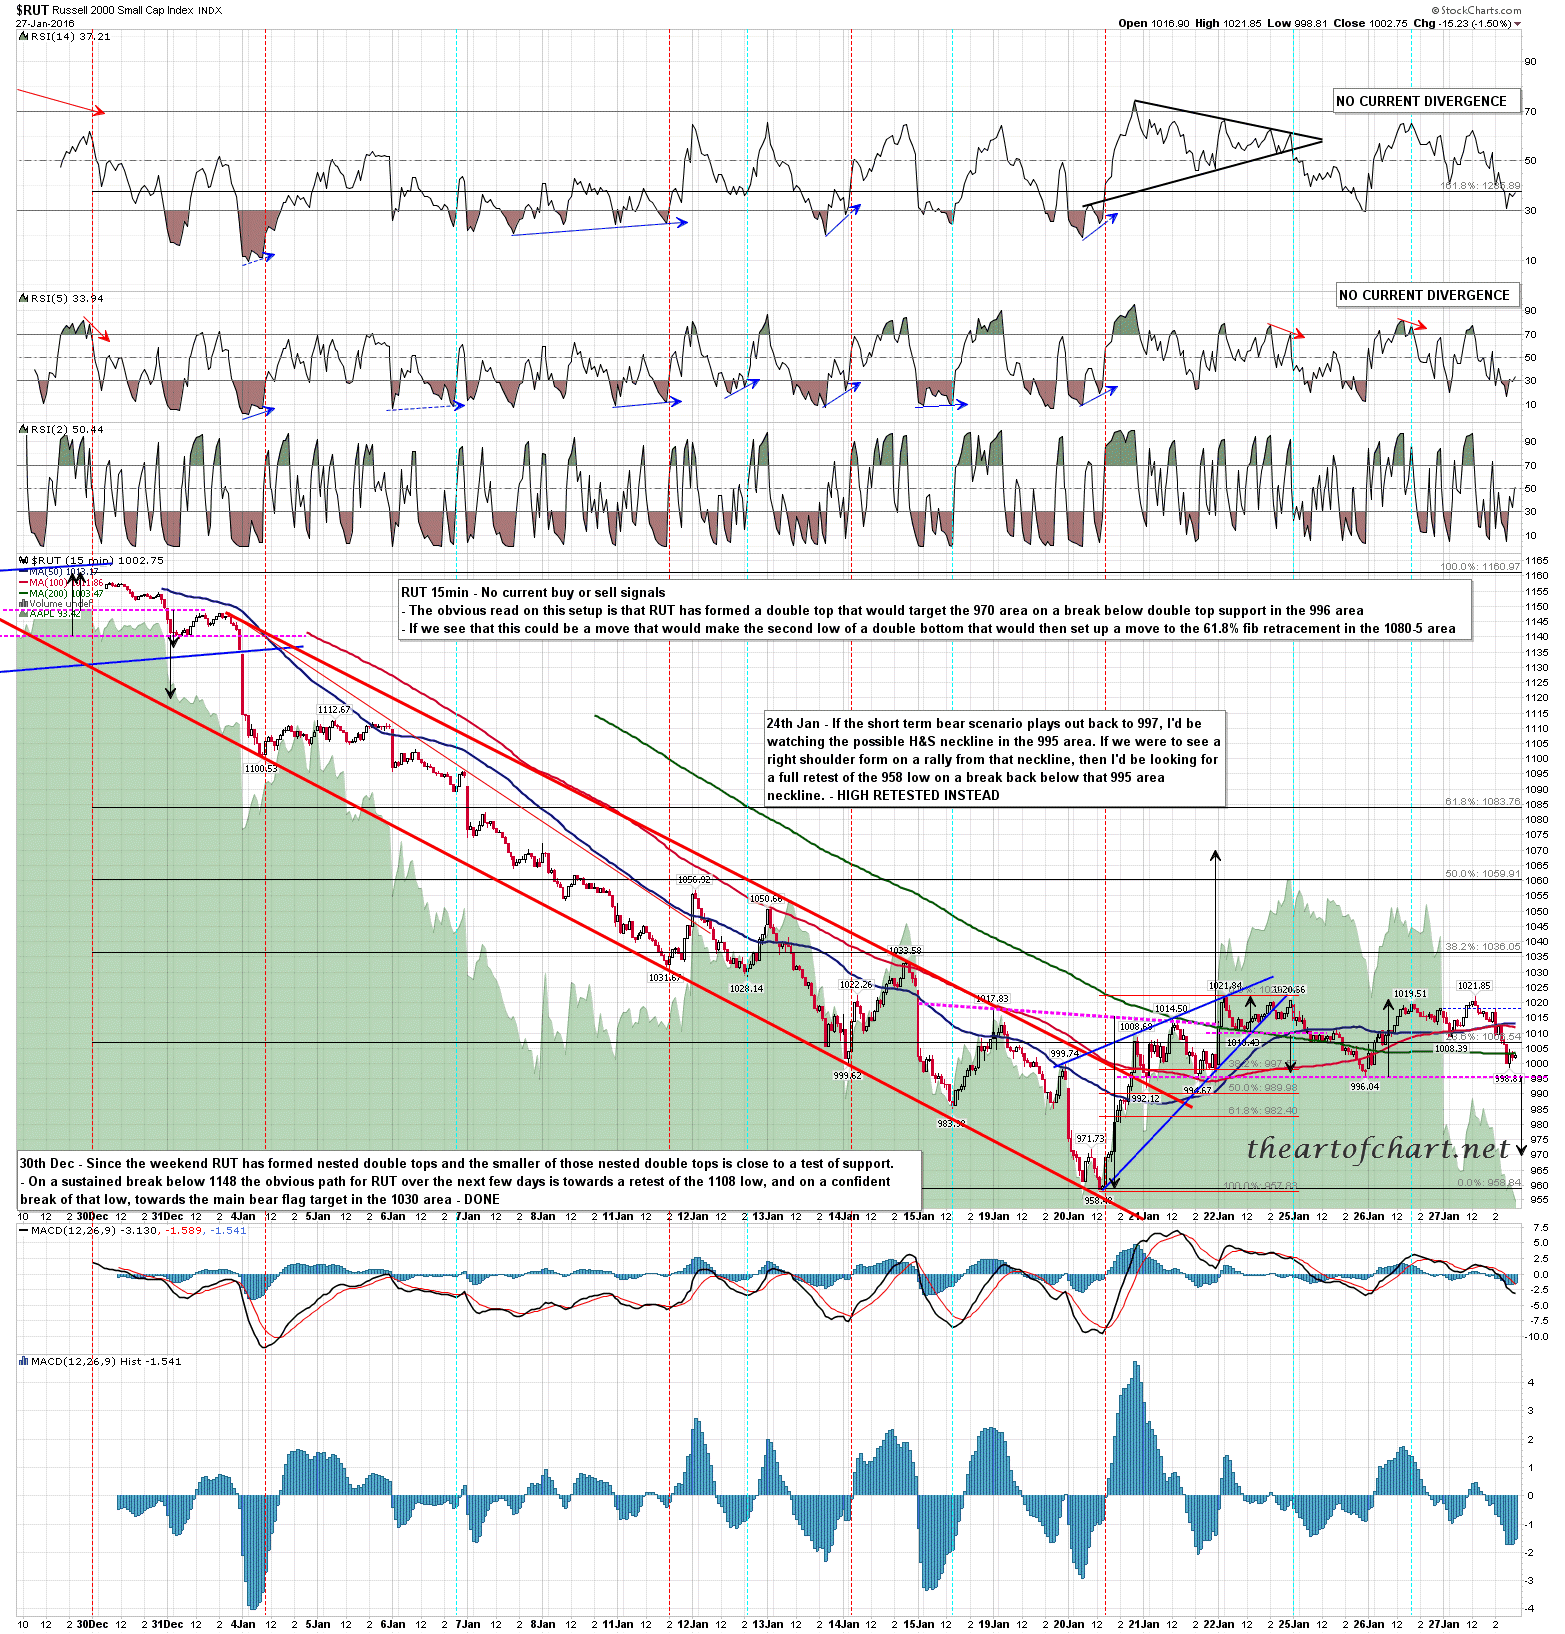
RUT 15min chart:
If we lose those 1884 & 1875 levels hard today then the rally may be over, though a retest of 1812 might well set up a double bottom for a larger rally into the ideal 2000 area rally target. If those levels hold today, be aware that that the next move up may just be a retest of the FOMC high before a retest of the lows.
