
Instead of doing videos this weekend, I’m just going to do an overview of some general, but I think important, charts. I don’t have these in any particular order, but I’ll make a few remarks about each of them. So here we go……..
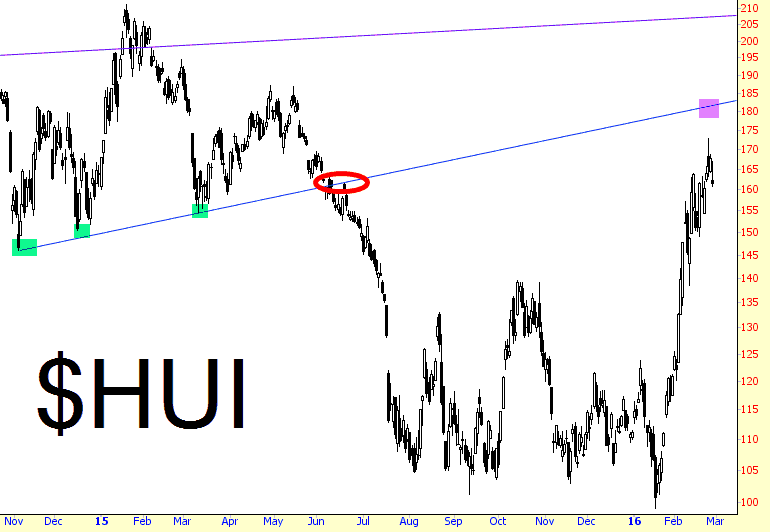
First up is the gold bugs index. This roared about 75% higher from its low just last month, and I definitely think it’s due for a breather. You can see how the trendline I’ve drawn represented supported (with green tints showing support in action), then it broke (red circle), and then the line changed its role to resistance (magenta tint).
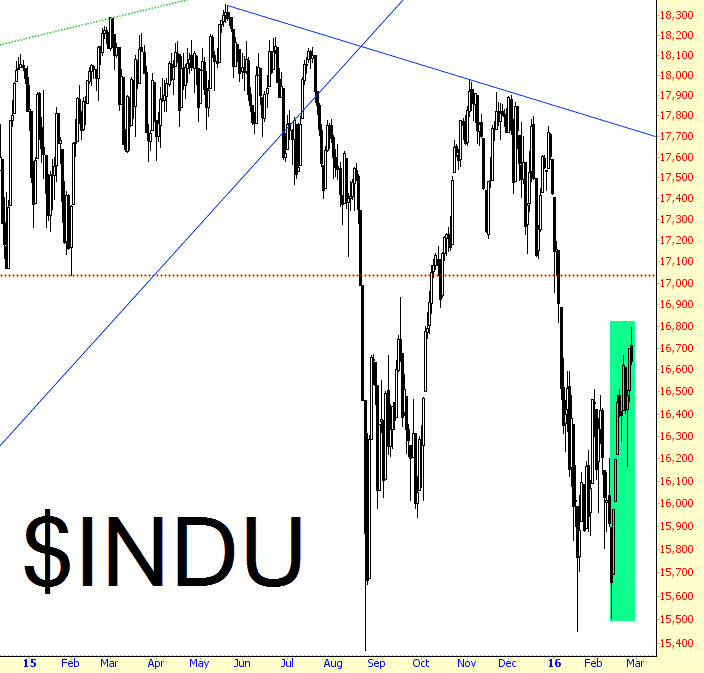
The Dow Industrials had its own ascent, and although the percentage move wasn’t as big, the point move was gigantic: nearly 1300 points in just a couple of weeks (this was no fun, let me assure you). It’s hard to pinpoint where all the overhead supply reaches critical mass, but I’ve drawn a horizontal just above 17,000 as a fairly decent guide for resistance.
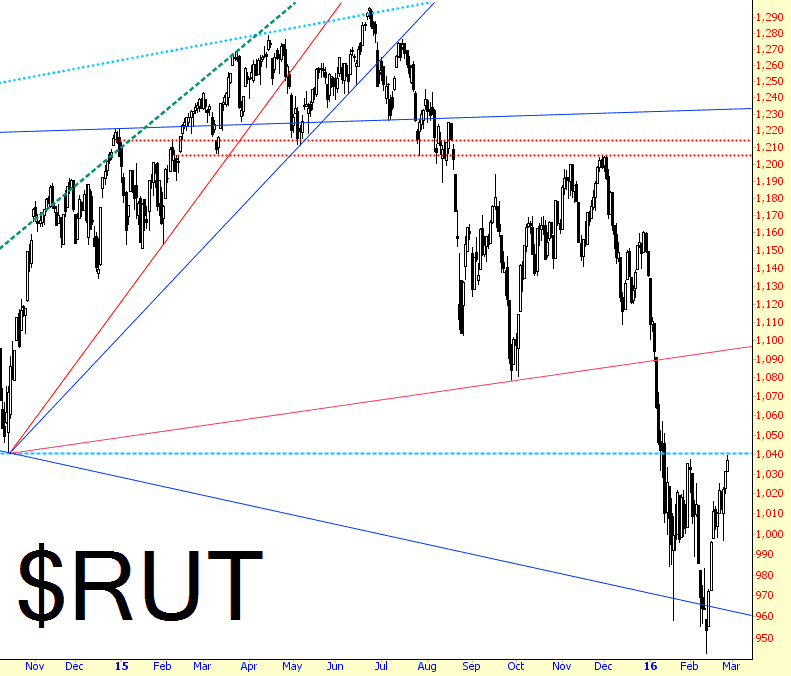
The Russell 2000 (small caps) obviously moved the same as any other big index, but its shape is somewhat different than most. The February 11 low was a meaningful amount lower than the one from January 20, and we’ve got a decent horizontal at 1040 which, for the moment, represents resistance. Crossing above this level would assign the new role of “resistance” to the tilted red trendline above it, which is at about 1100.
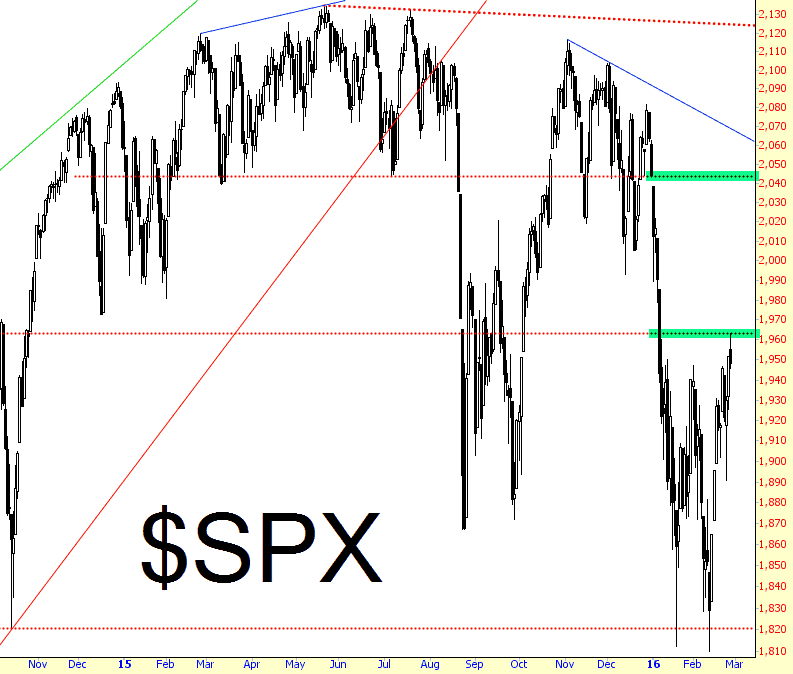
The S&P 500 harkens back to my Thing One and Thing Two post, which you can see with the green tints below. Of course, now that Gartman has abandoned his bearish stance and is once again bullish, we might have a real chance at avoiding a trek to the higher level.
The Transports are a particularly fascinating chart. The graph below doesn’t show it from the long-term perspective, but from a greater distance, transportation stocks look exceptionally toppy.
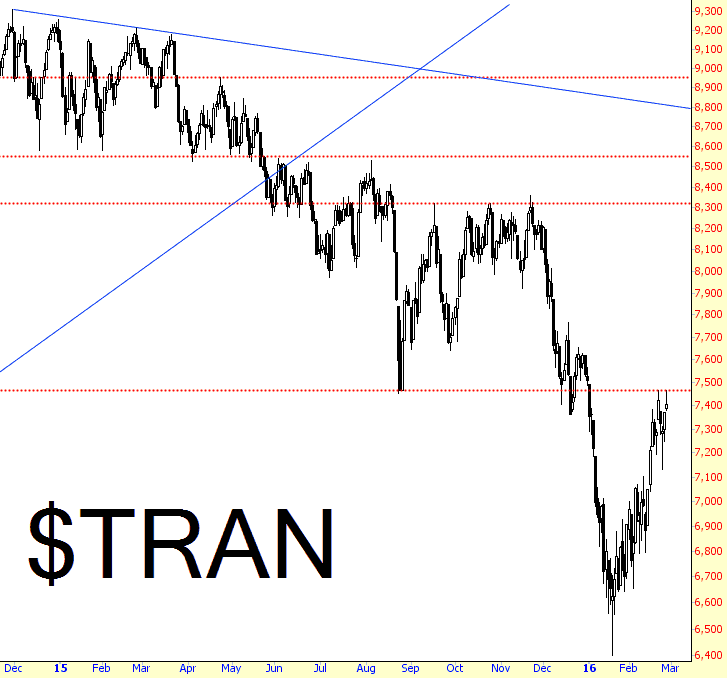
I’ll publish more of these Sunday morning.
