The title is a paraphrase of “the scariest gold chart in the world” (target below $400) someone sent me in 2009, just before the gold price began its $900 per ounce upward journey. So that’s the contrarian caveat and indeed, I hesitate to write bearish things at a time when small speculators are way too short the market and everybody already seems to know how bearish things are.
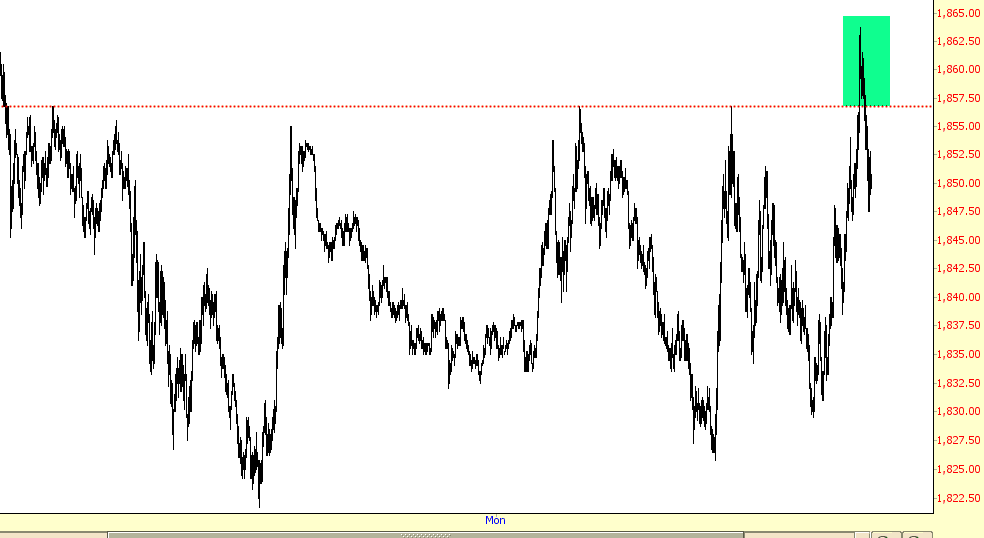
But the chart is the chart and without further ado, meet the scariest US stock market chart in the world. I was ready to try a long on the SPY yesterday, but decided to wait because of this (being posted here because it never made it into NFTRH 381’s already bloated 42 pages) chart and some others in the face of which I just could not rationalize a bullish stance. Capital preservation is job 1 now, not bullish speculation. I’ll let the bulls prove something first.