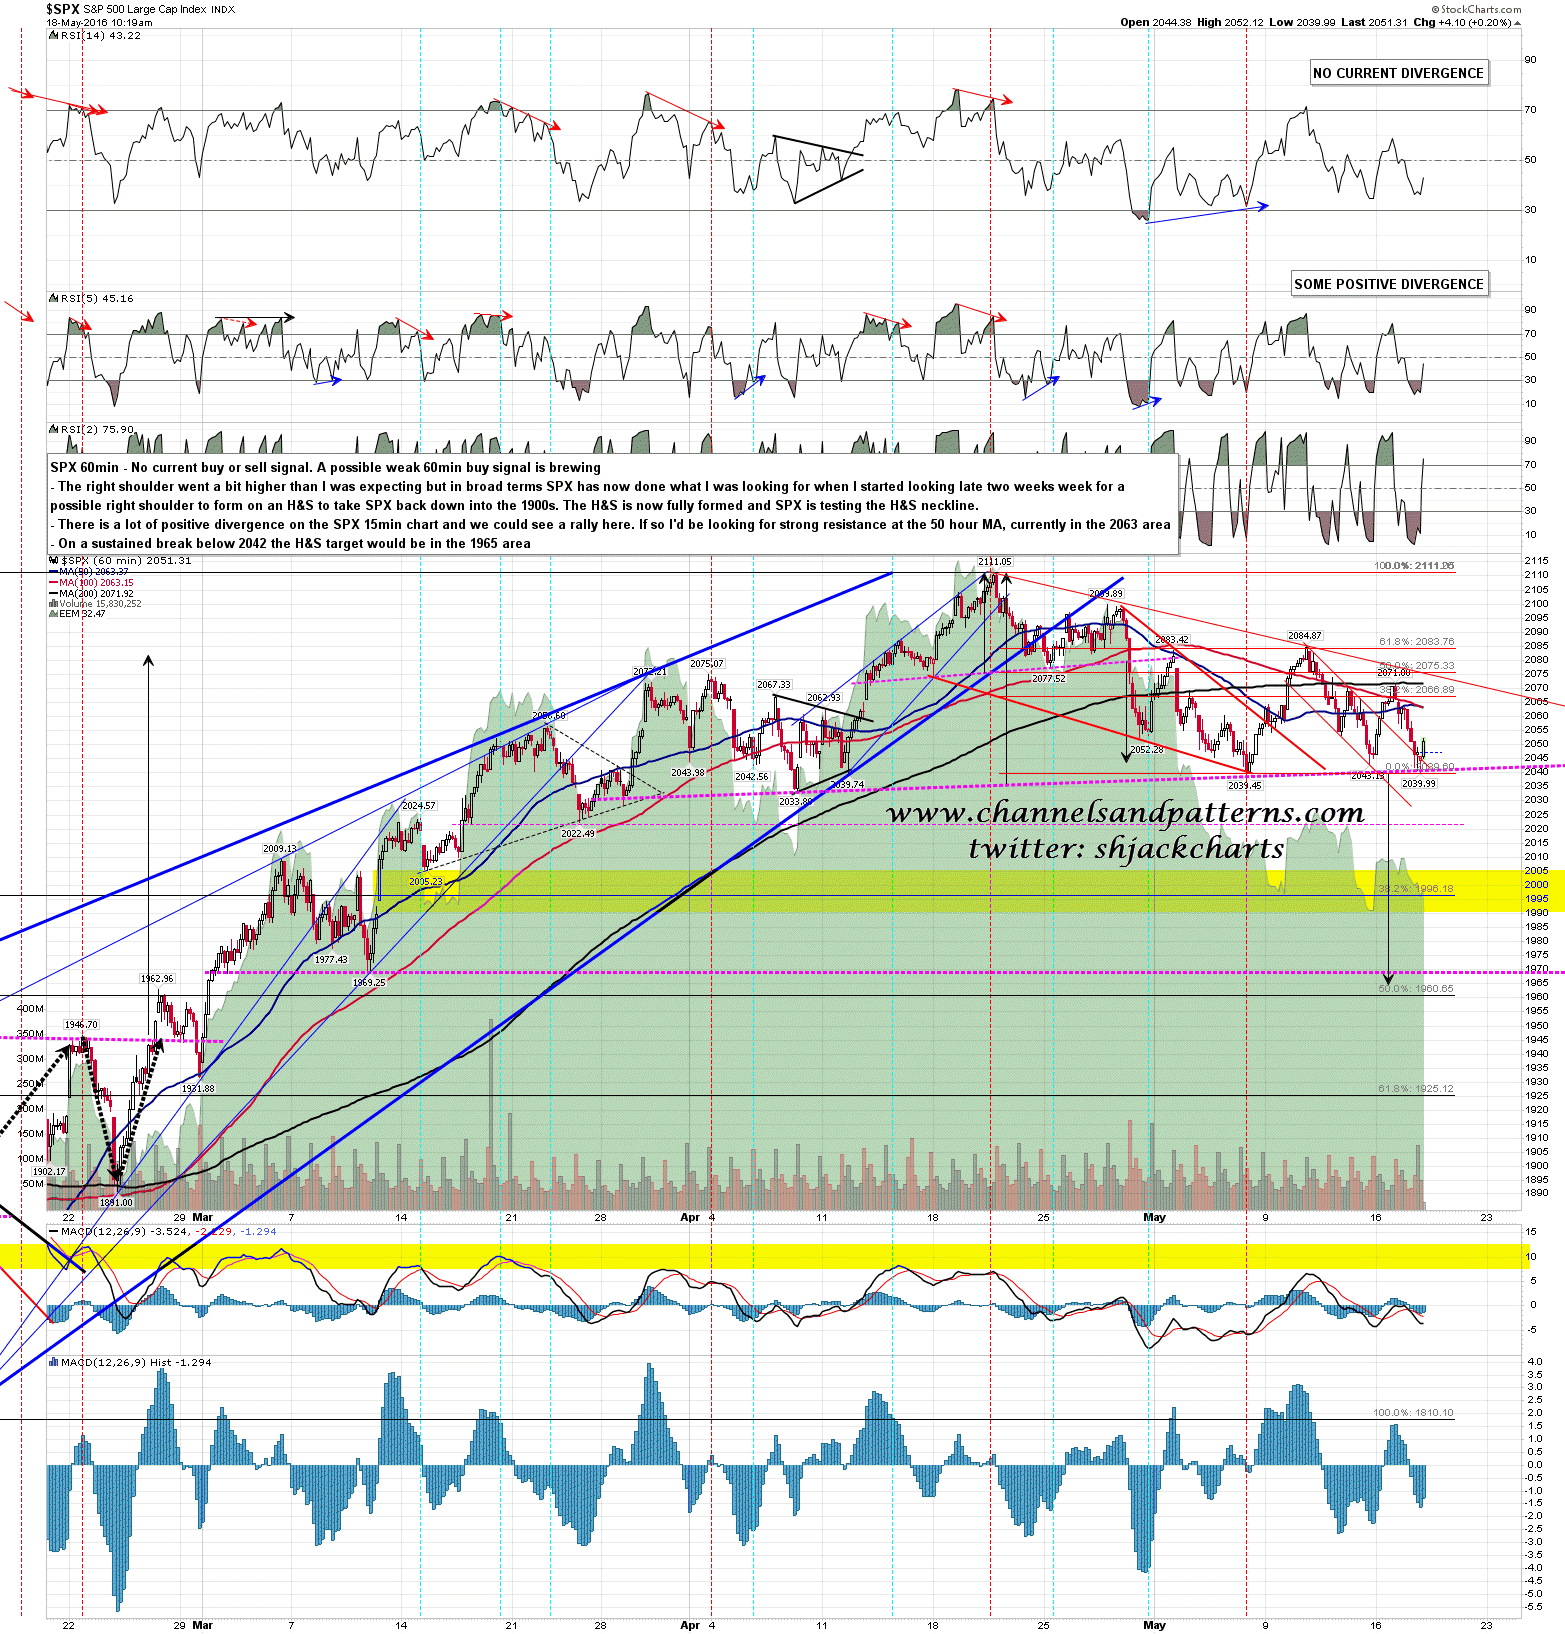
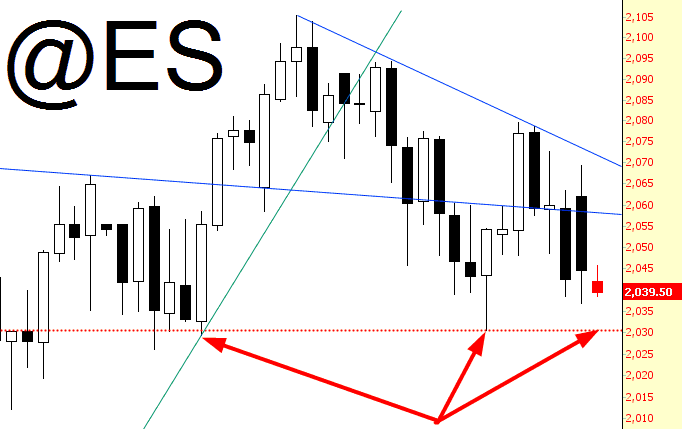
It’s been an interesting and rather spiky journey forming the right shoulder on the SPX H&S that I called as possibility a couple of weeks ago now, but that right shoulder is now fully formed and was testing the neckline at the lows yesterday. On a sustained break below that neckline the H&S target would be in the 1965 area, and for a number of reasons that is a very attractive target and possible low area for this decline from the latest swing high.
There was a lot of positive divergence on the 15min charts at the close last night and we are seeing a rally this morning. The big resistance levels on SPX that I’m watching here in the event that the rally heads higher are the 50 hour MA at 2063, and the daily middle band at 2070. SPX 60min chart: