
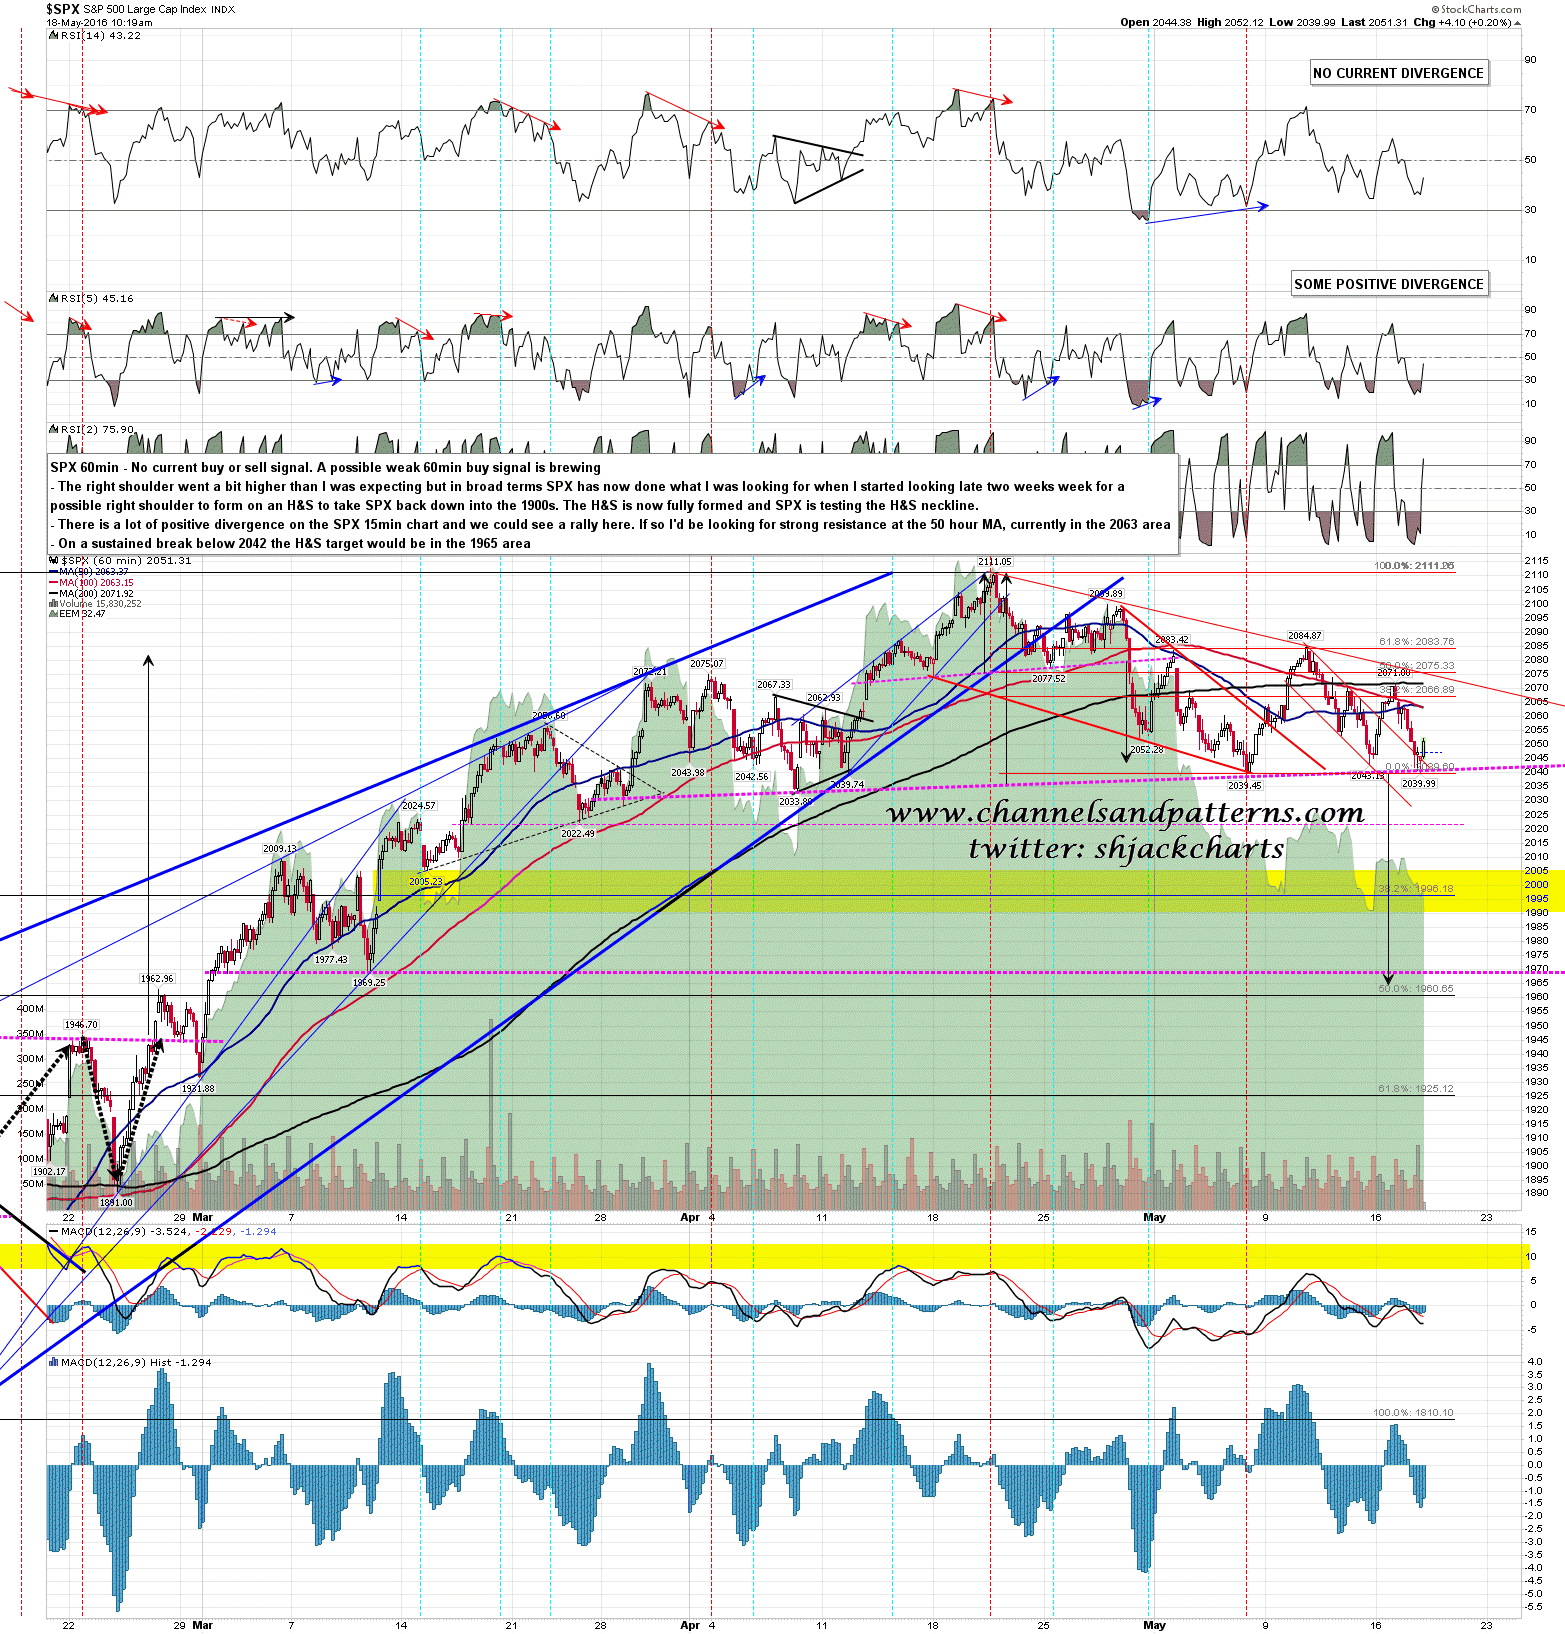
It’s been an interesting and rather spiky journey forming the right shoulder on the SPX H&S that I called as possibility a couple of weeks ago now, but that right shoulder is now fully formed and was testing the neckline at the lows yesterday. On a sustained break below that neckline the H&S target would be in the 1965 area, and for a number of reasons that is a very attractive target and possible low area for this decline from the latest swing high.
There was a lot of positive divergence on the 15min charts at the close last night and we are seeing a rally this morning. The big resistance levels on SPX that I’m watching here in the event that the rally heads higher are the 50 hour MA at 2063, and the daily middle band at 2070. SPX 60min chart:
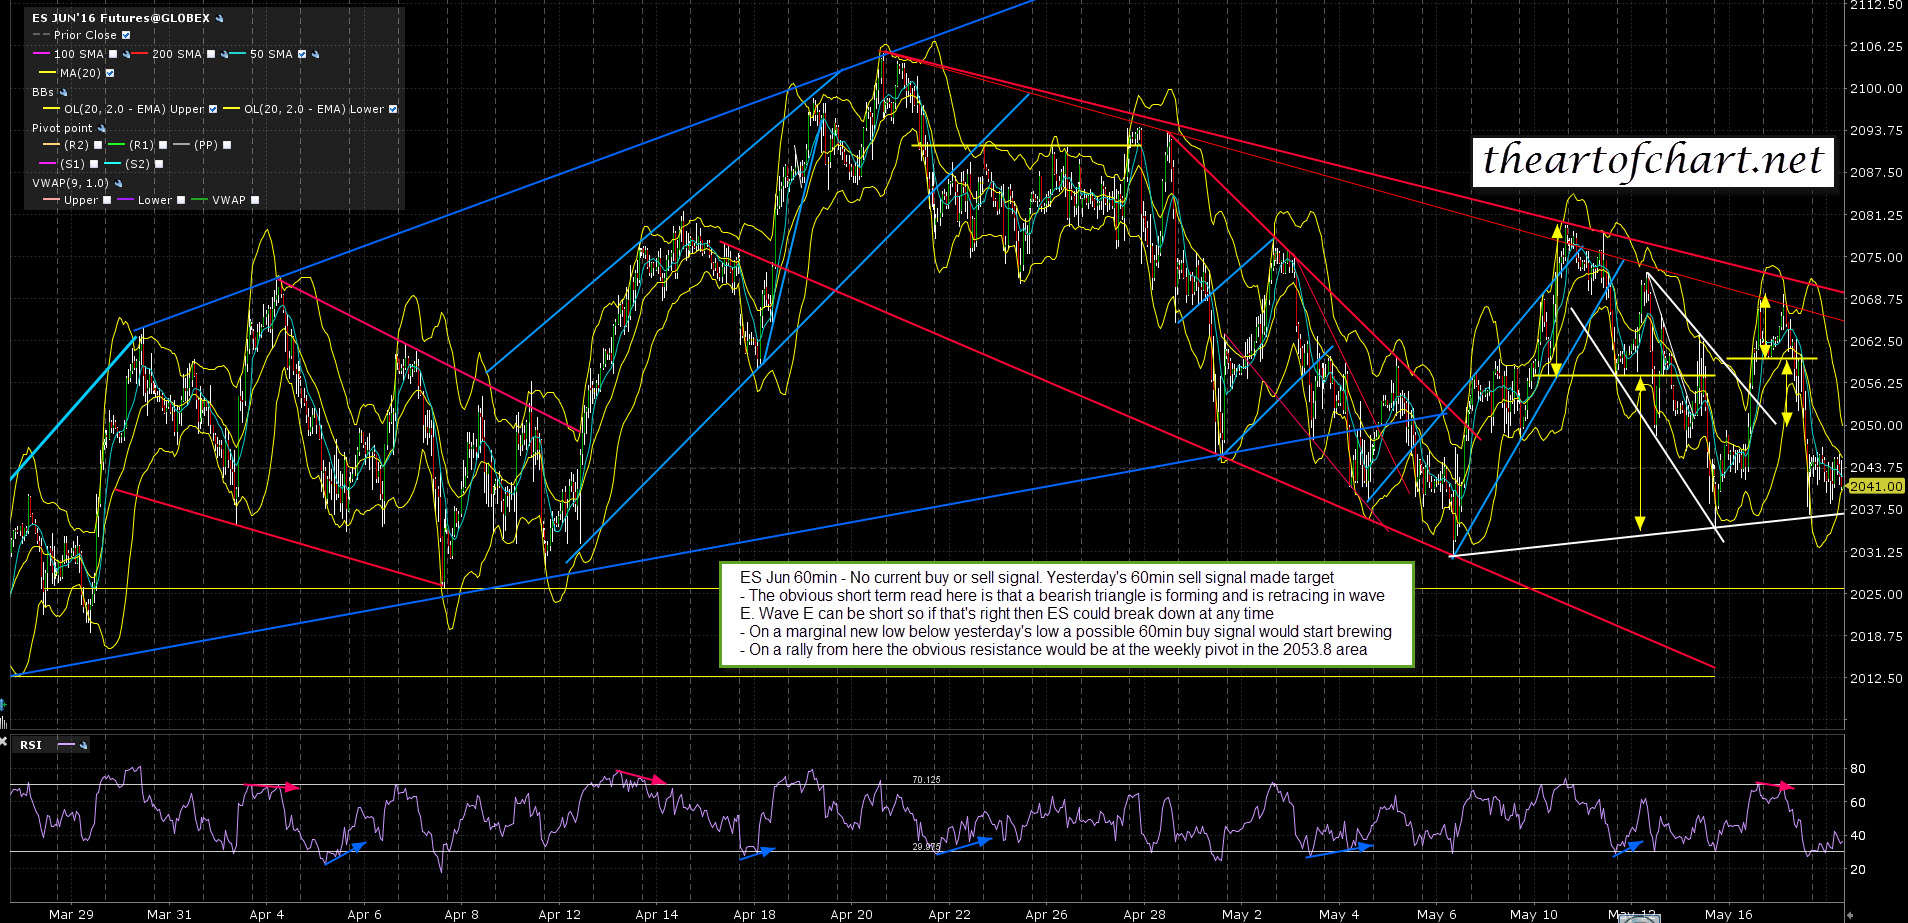
Is there some reason to think that the rally today might be stronger than expected? Yes there is. I mentioned the 60min buy signals on Monday morning before the trend up day. I mentioned the 60min sell signals on ES, TF and NQ before the strong decline we then saw yesterday. This morning I have freshly minted 60min buy signals on ES, NQ and TF and am watching the rally this morning with great interest.
This morning’s rally could run away. Most likely it would run away into a lower high, but that gives 1% of leeway above on SPX at the time of writing, so that could be an uncomfortable experience for shorts holding through that. ES Jun 60min chart:
Unless we see SPX convert the daily middle band at 2070 back into support that H&S is likely to play out. Would I be astounded if SPX closed green today? No. Would I regard a strong rally into a lower high on SPX today as bullish? No. That setup didn’t look bullish on Monday night, and it wouldn’t look bullish today either if seen.
There is nothing ever inherently bullish about rallies into lower highs. If bulls want to deliver something that looks bullish they really need to break back over the daily middle band and then hold it as support on a retest. Anything short of that is just noise.
