
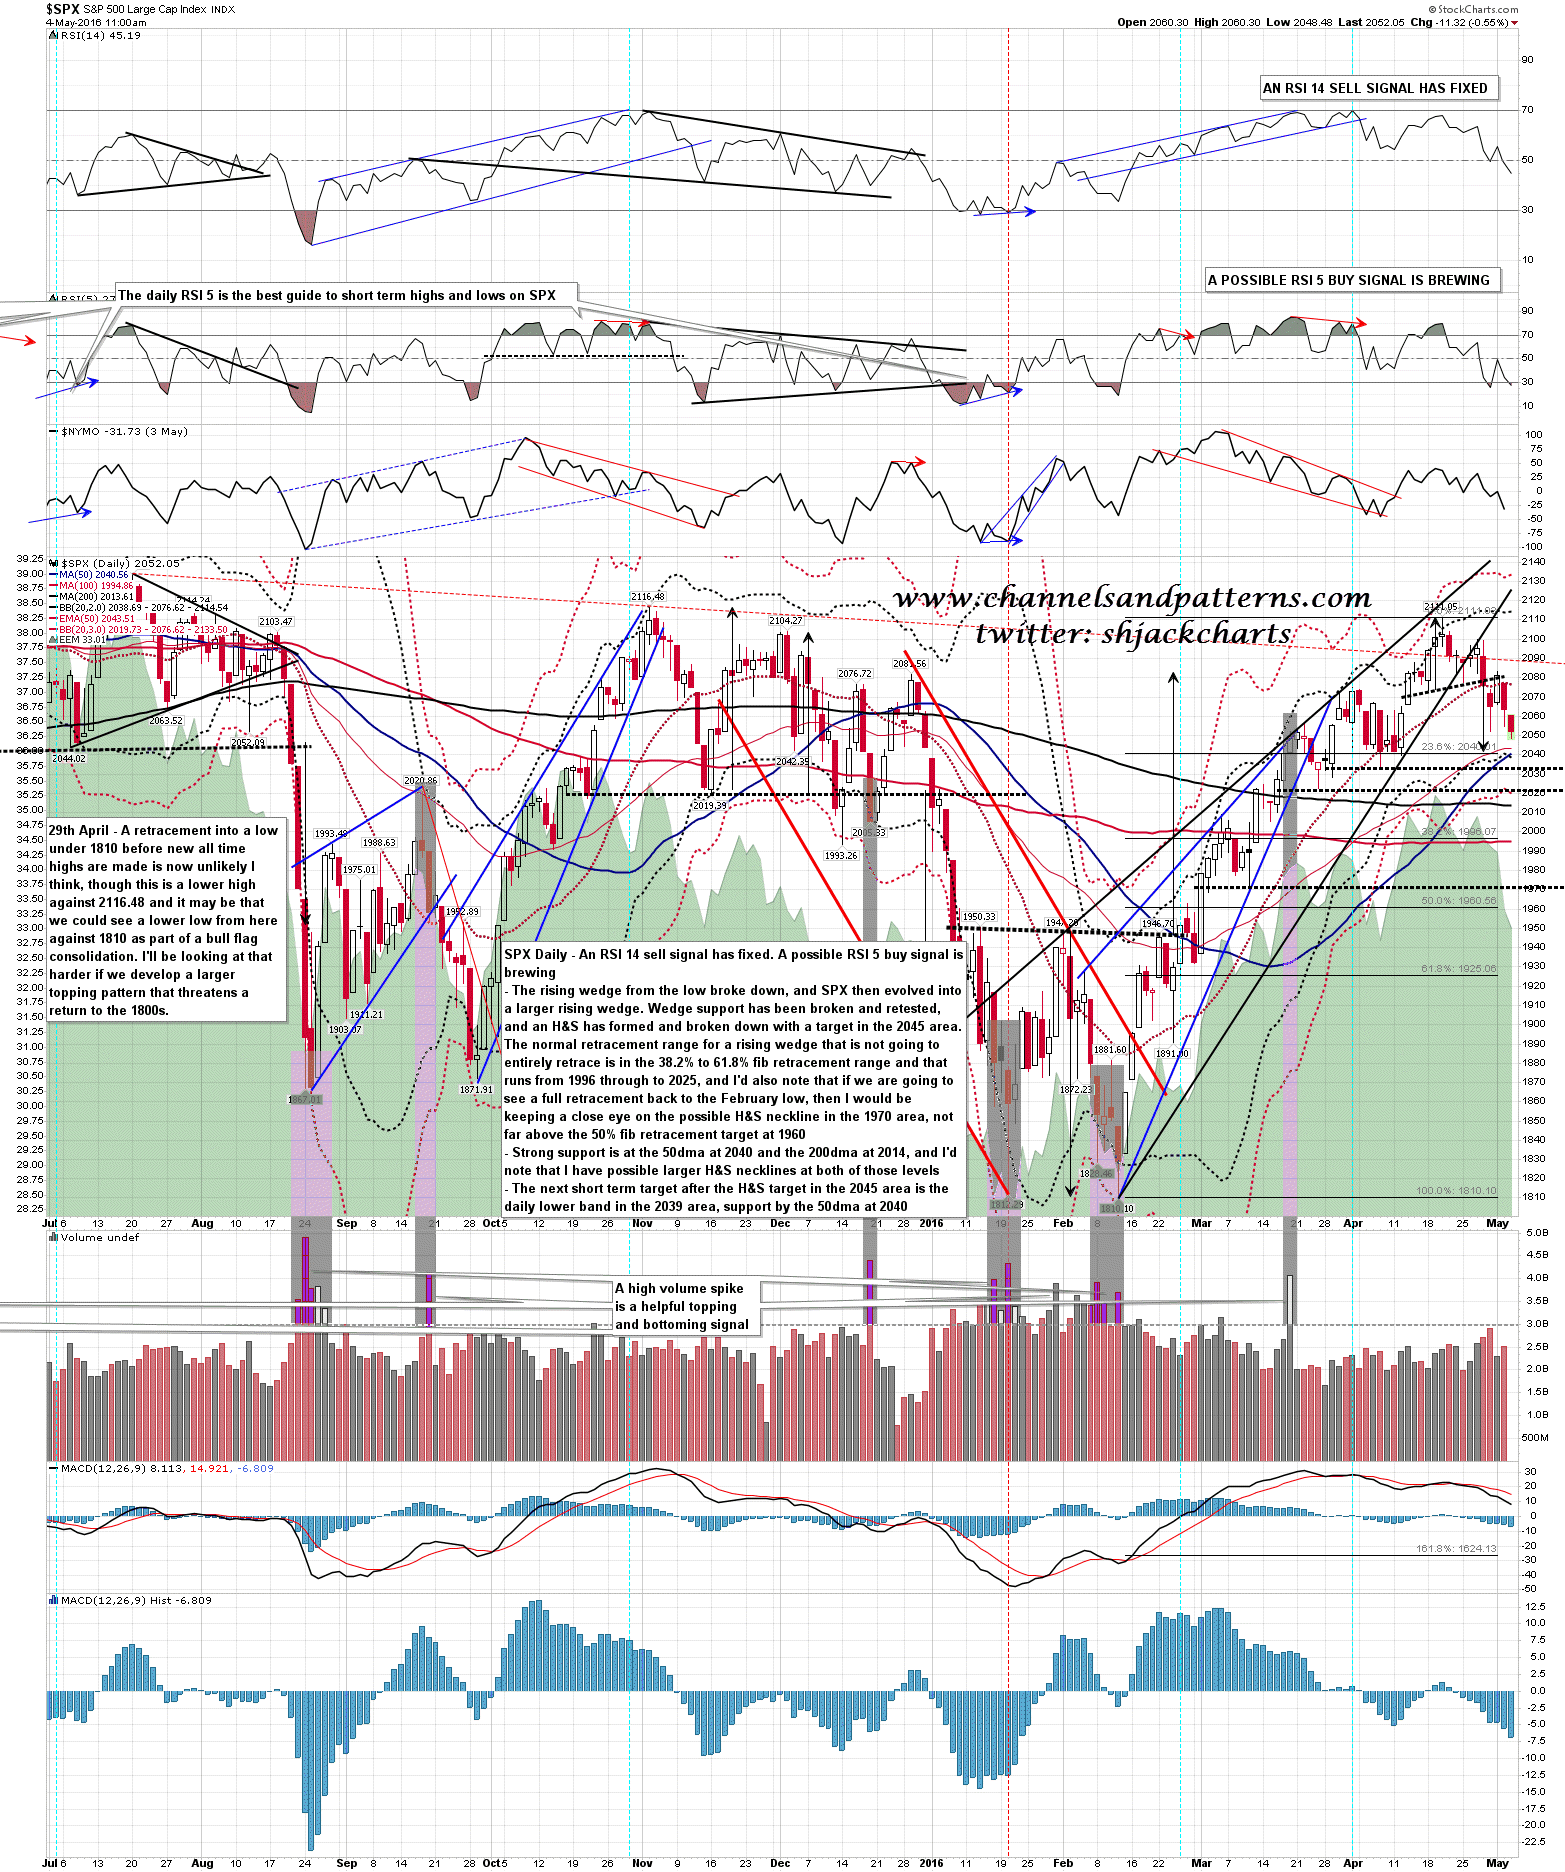
On the SPX daily chart the setup here is straightforward. The current SPX low is at 2047, very close to the H&S target at 2045. As the daily middle band has been converted to resistance the daily lower band is now a solid target at 2039, and that is supported by the 50dma at 2040. A break below these opens lower targets. SPX daily chart:
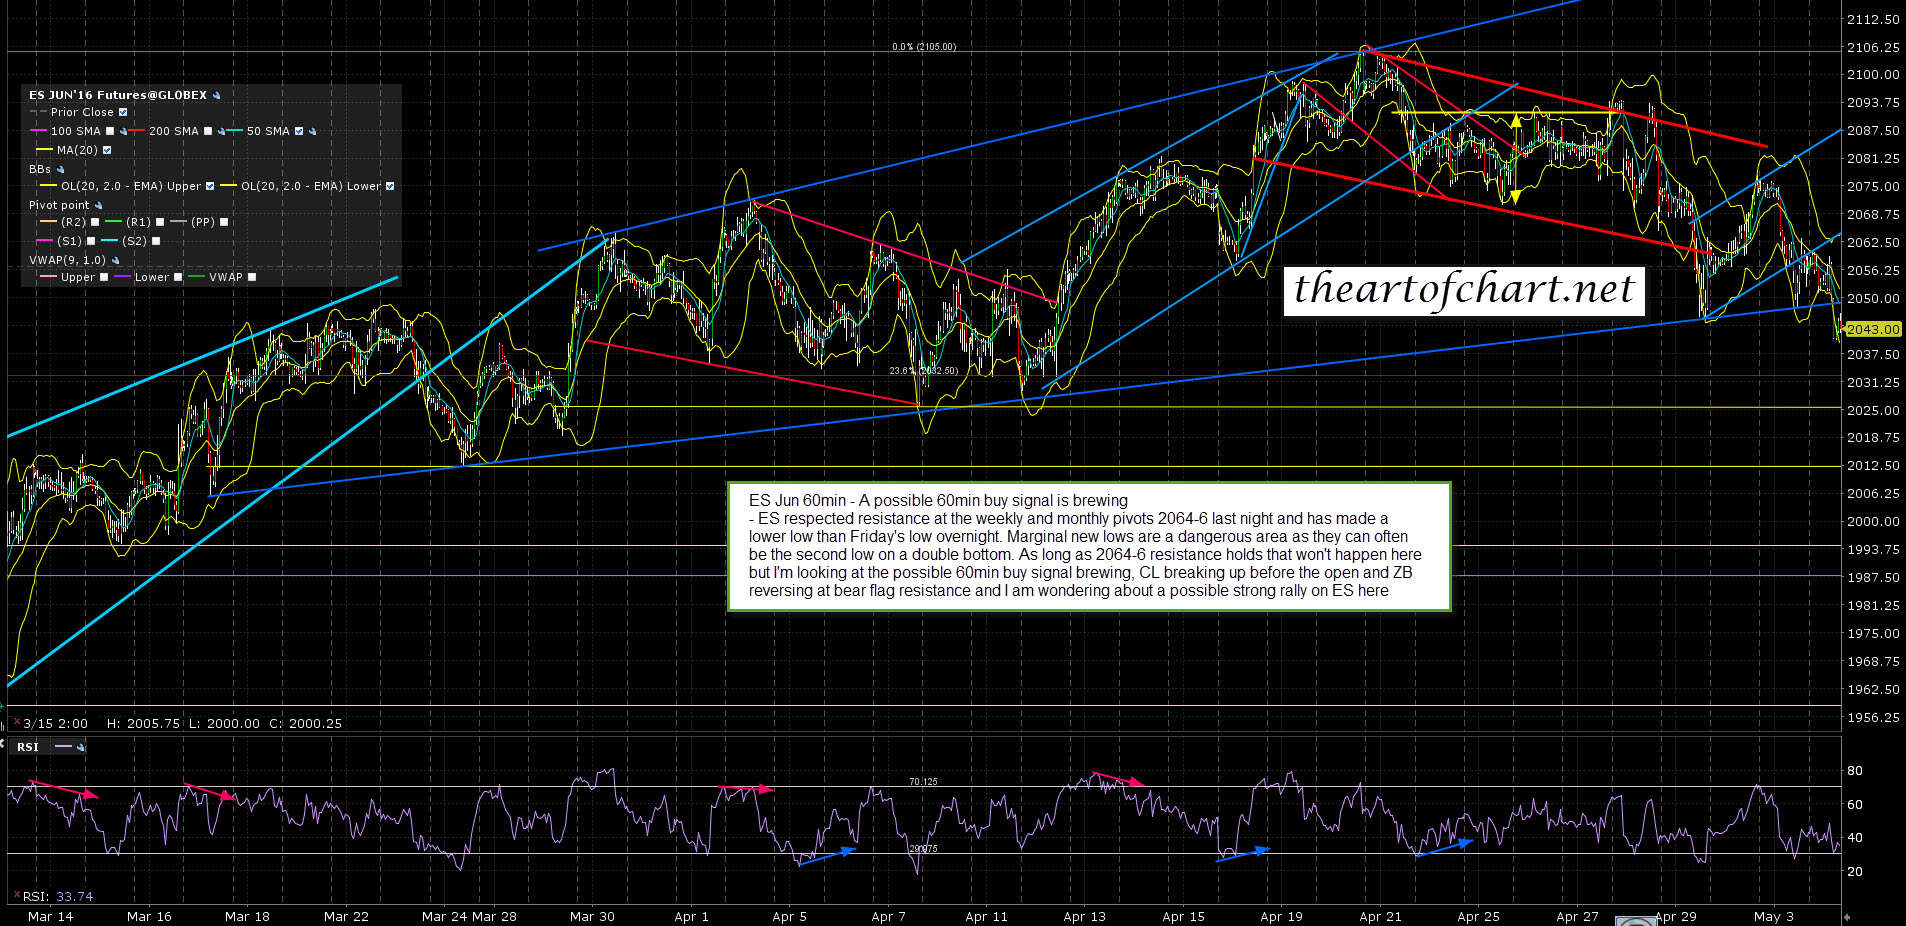
A possible 60min buy signal is brewing on ES, which is a concern for bears here. One was also brewing on TF at the time I capped this chart and that has now fixed. ES is stalled at 2040 at the moment and I’m wondering if that might hold. The top priority for bears today is to break that and convert it to resistance. ES Jun 60min chart:
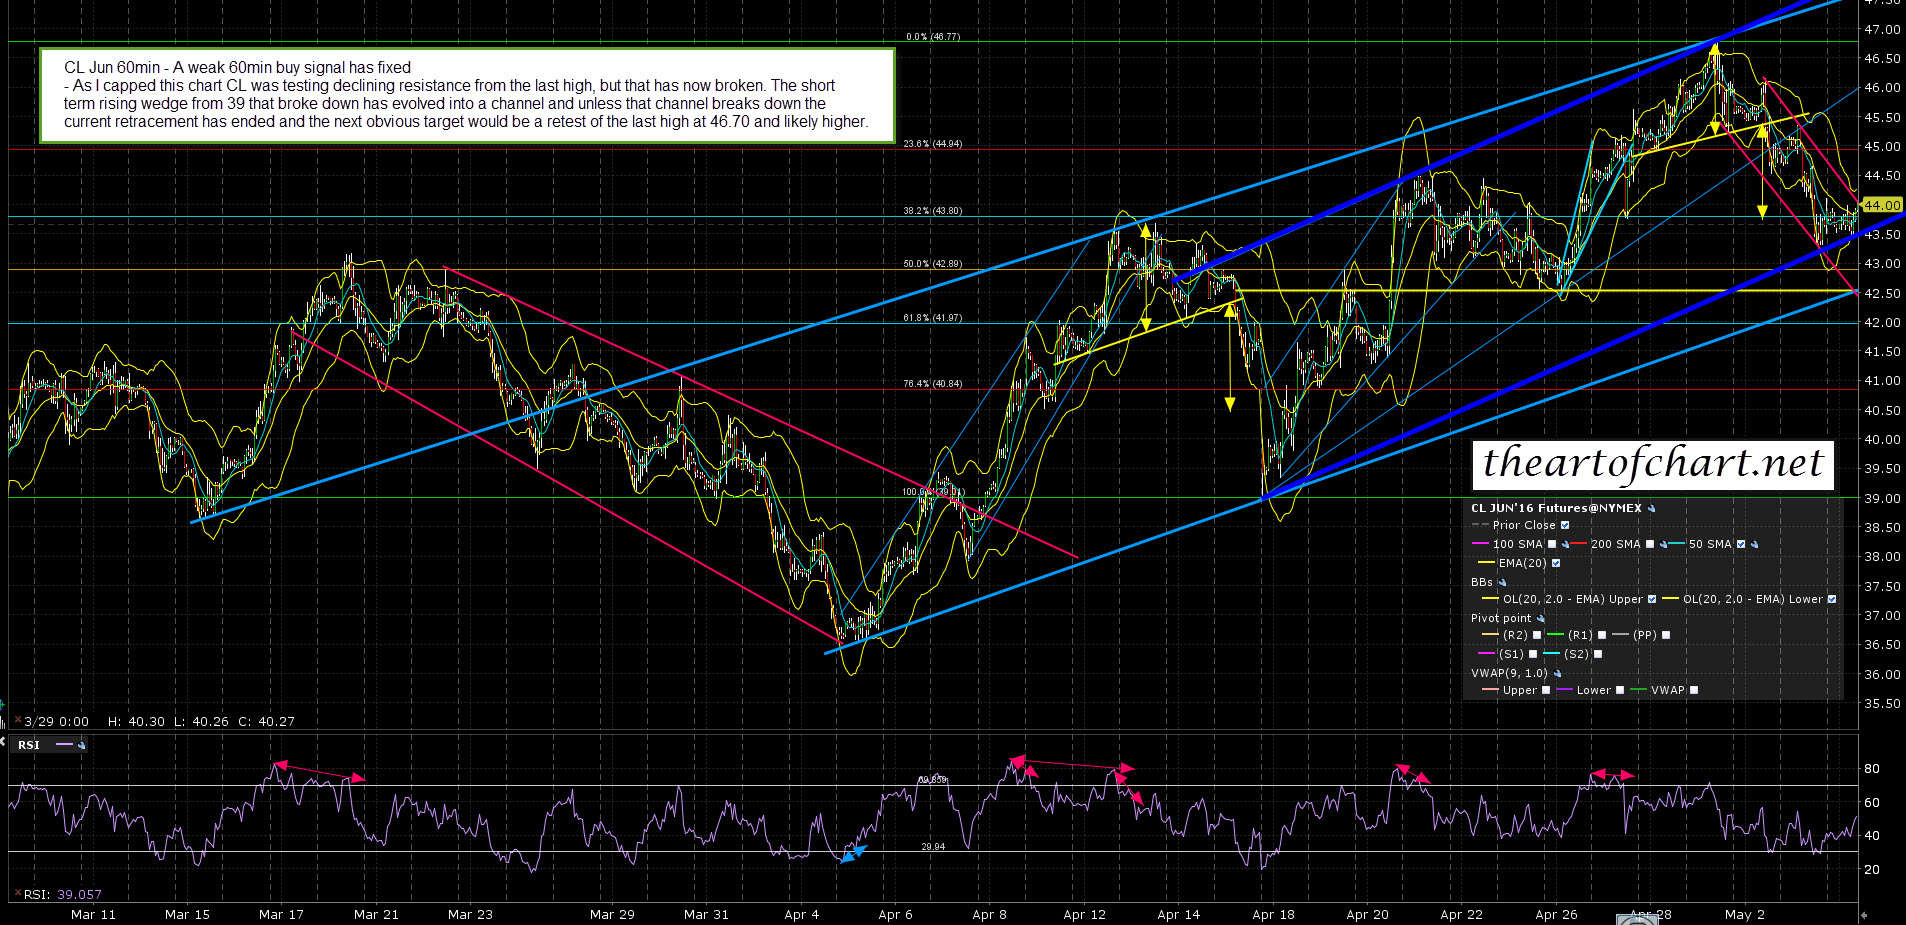
I’m not much on trading correlations but I was struck by two other charts this morning that could favor bulls today. The first is CL, which broke declining resistance this morning after establishing a rising wedge turned channel. That channel support is now close to being retested at 43.5, but if that holds then the current retracement on CL is likely over, and CL has been trading with a strong positive correlation to ES in recent days. CL Jun 60min chart:
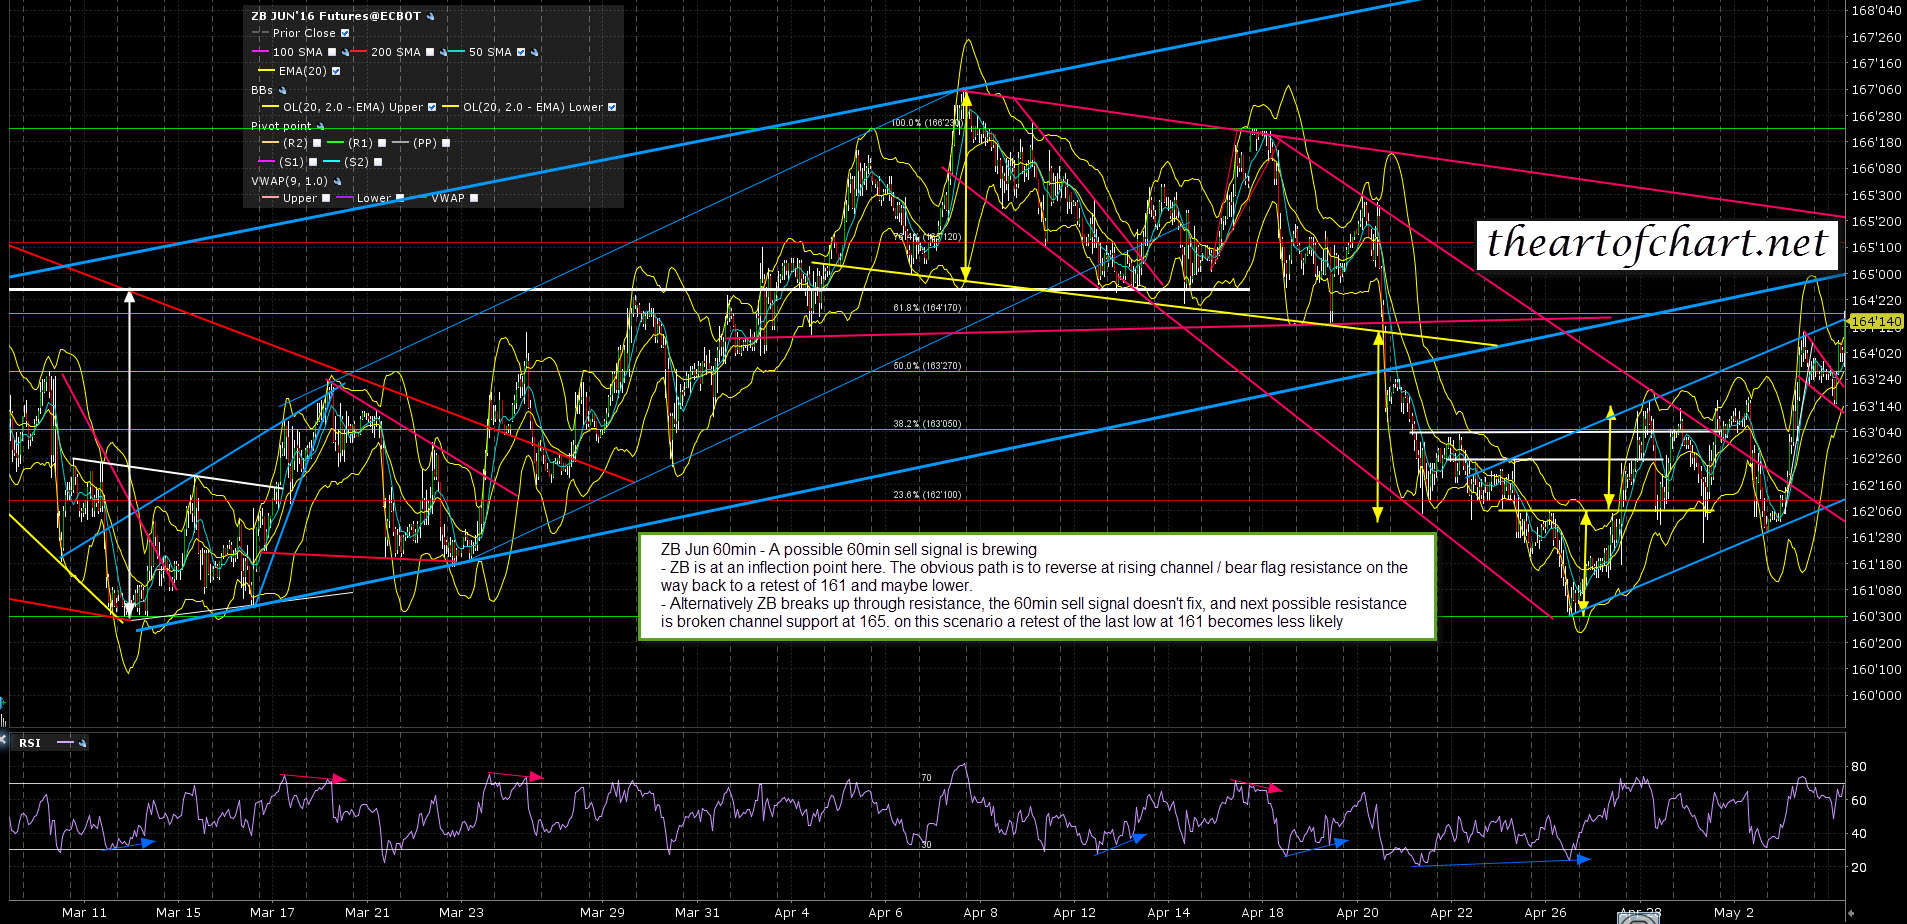
My other concern here is ZB, which has been trading inversely correlated to ES in recent days, as it often does. ZB is testing bear flag resistance and that resistance has not yet broken, though ZB hasn’t yet broken down decisively from it as yet either. If CL breaks up hard and ZB breaks down hard here then that might be a tough headwind for bears to push through. ZB Jun 60min chart:
There is obvious support on SPX in the 2039 to 2045 area. Bears need to break down through that and convert it to support here or the possible double bottom setups here might deliver a strong rally.
