Here’s your swing-trading watch-list:
Long Celanese (CE)

Slope initially began as a blog, so this is where most of the website’s content resides. Here we have tens of thousands of posts dating back over a decade. These are listed in reverse chronological order. Click on any category icon below to see posts tagged with that particular subject, or click on a word in the category cloud on the right side of the screen for more specific choices.
The bulls delivered a strong confirming daily candle and tested the daily upper band on SPX yesterday. The good news for bears is that 60min sell signals have now fixed on ES, NQ and TF, with all of them looking close to starting a decent retracement. The bad news for bears is that if seen at all, the low on that retracement is most likely a strong buy, as the technical picture has now shifted heavily in favor of the bulls. I’ll explain why below.
I’ll start with the most bear friendly of the daily charts. On RUT the obvious next target is a retest of the current swing high, though the limited retracement seen so far would suggest that retest should be the second high of a double top before a larger retracement. On the TF chart there is an open IHS target at the retest of the current swing high. RUT daily chart: (more…)
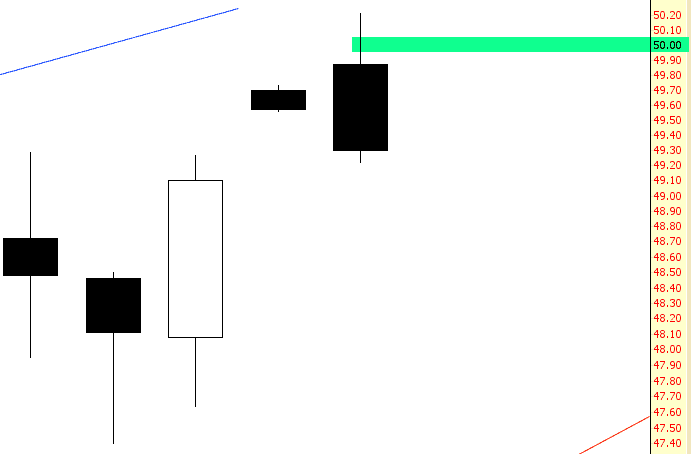
Markets often have an obsession with Big Round Numbers (20000 on the Dow, 2000 on the S&P 500, 5000 on the NASDAQ, and, most relevant today, 50 for crude oil).
Well, crude oil, after having risen nearly SEVENTY PERCENT (which is just great for the economy, right?) in the past few months, made its Big Round Number today and promptly reversed into a bearish engulfing pattern.
As much as I’d love to pretend things are just hunky-dory, they’re not. This market has (for me, at least) really been a nightmare lately. The big picture bear tops aren’t broken (yet!) but after last Thursday, the bulls have been gaining power and momentum.
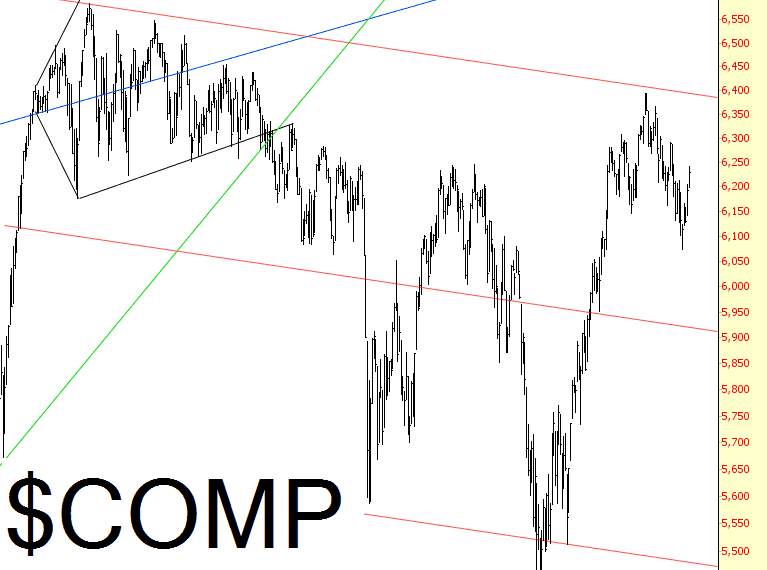
Looking at the Dow Composite, the descending channel is still completely intact, and all the up and down action over the past couple of months may ultimately turn out to be nothing more than just another pattern-within-a-pattern in the context of a generally descending market.