
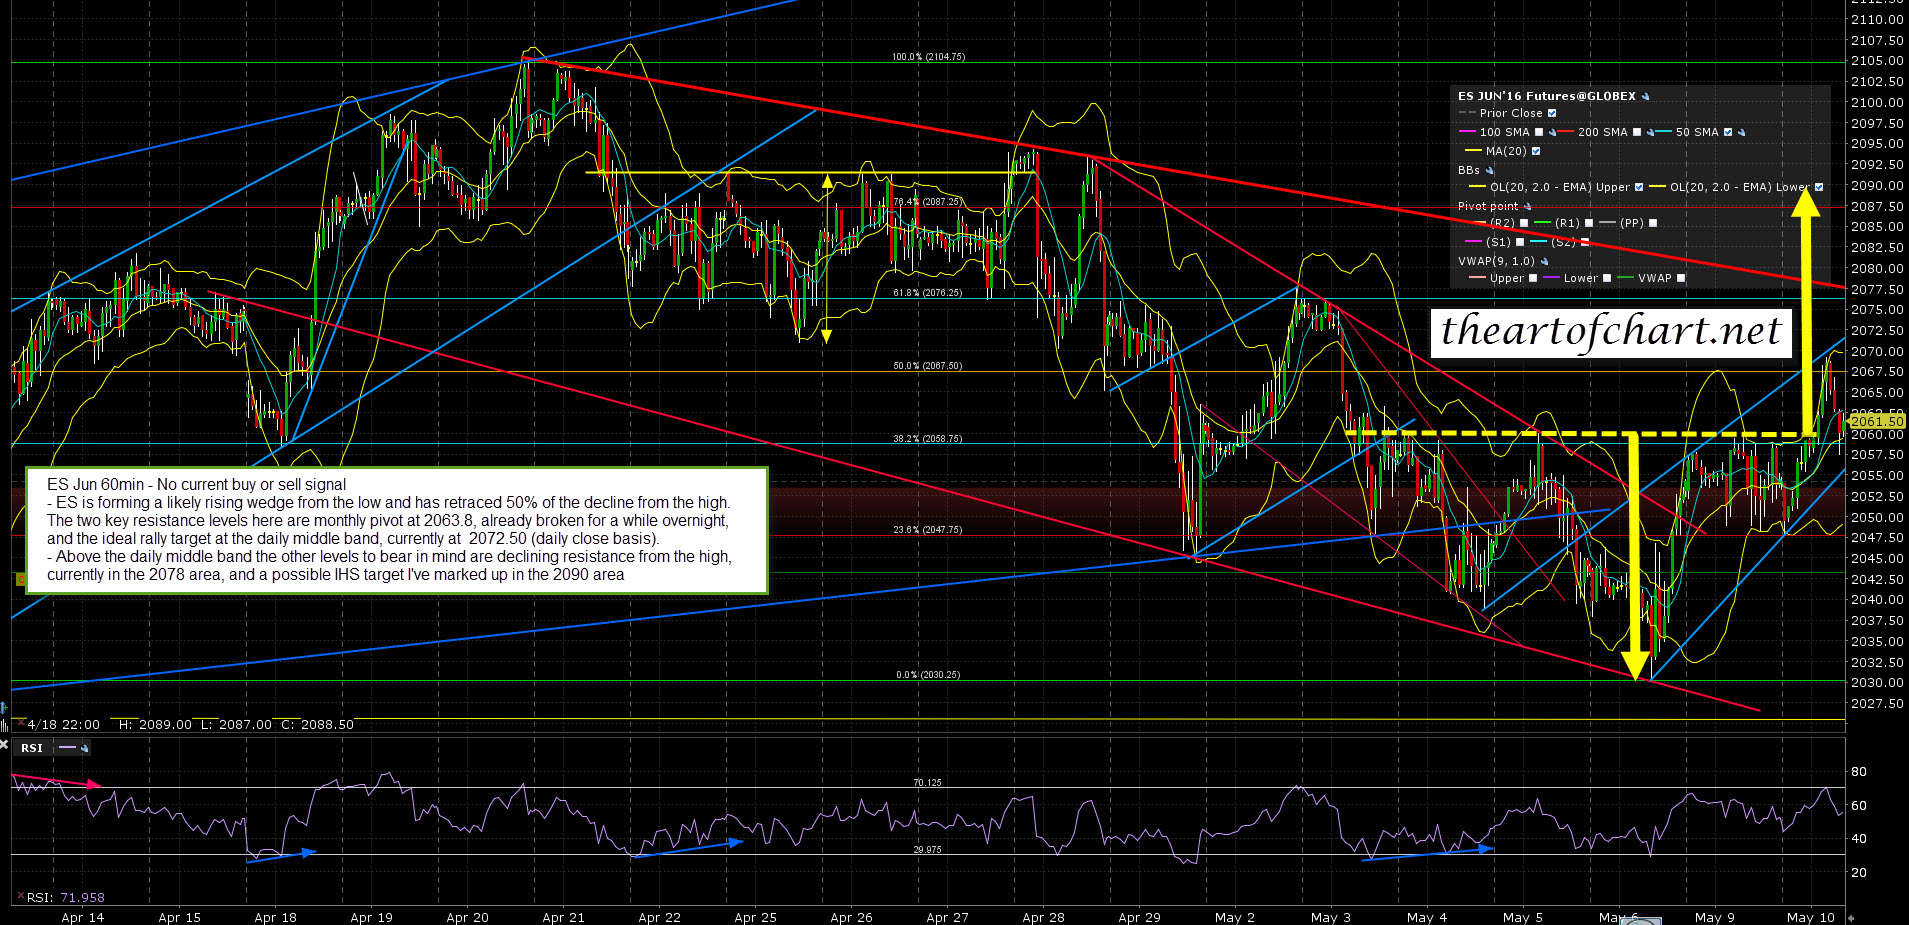
The tape was pretty uncertain yesterday and the flush at the close fixed 15min sell signals on RUT and NDX that had me very much wondering whether the rally had already topped out. Happily that wasn’t the case and both SPX and ES are now close to a test of the ideal rally target at the daily middle band, currently at 2072.5 on ES and 2079 on SPX. That doesn’t need to be tested exactly, the current AM high at 2075 at the time of writing would do just fine.
I would draw your attention to the possible IHS that has formed and broken up on the ES chart below. That’s still very much the lower probability option in my view, but it is very much still an option, and if the daily middle band fails to hold as resistance here then that would become the higher probability option, though the opening setup here strongly favors the bears in my view. ES Jun 60min chart:
On TF a very nice rising wedge has formed from the low and 50% of the decline from the high has been retraced. Since I capped this chart TF has broken wedge support and should now be in the topping process. This is the nicest pattern setup from the low and obviously favors the bears here. TF Jun 60min chart:
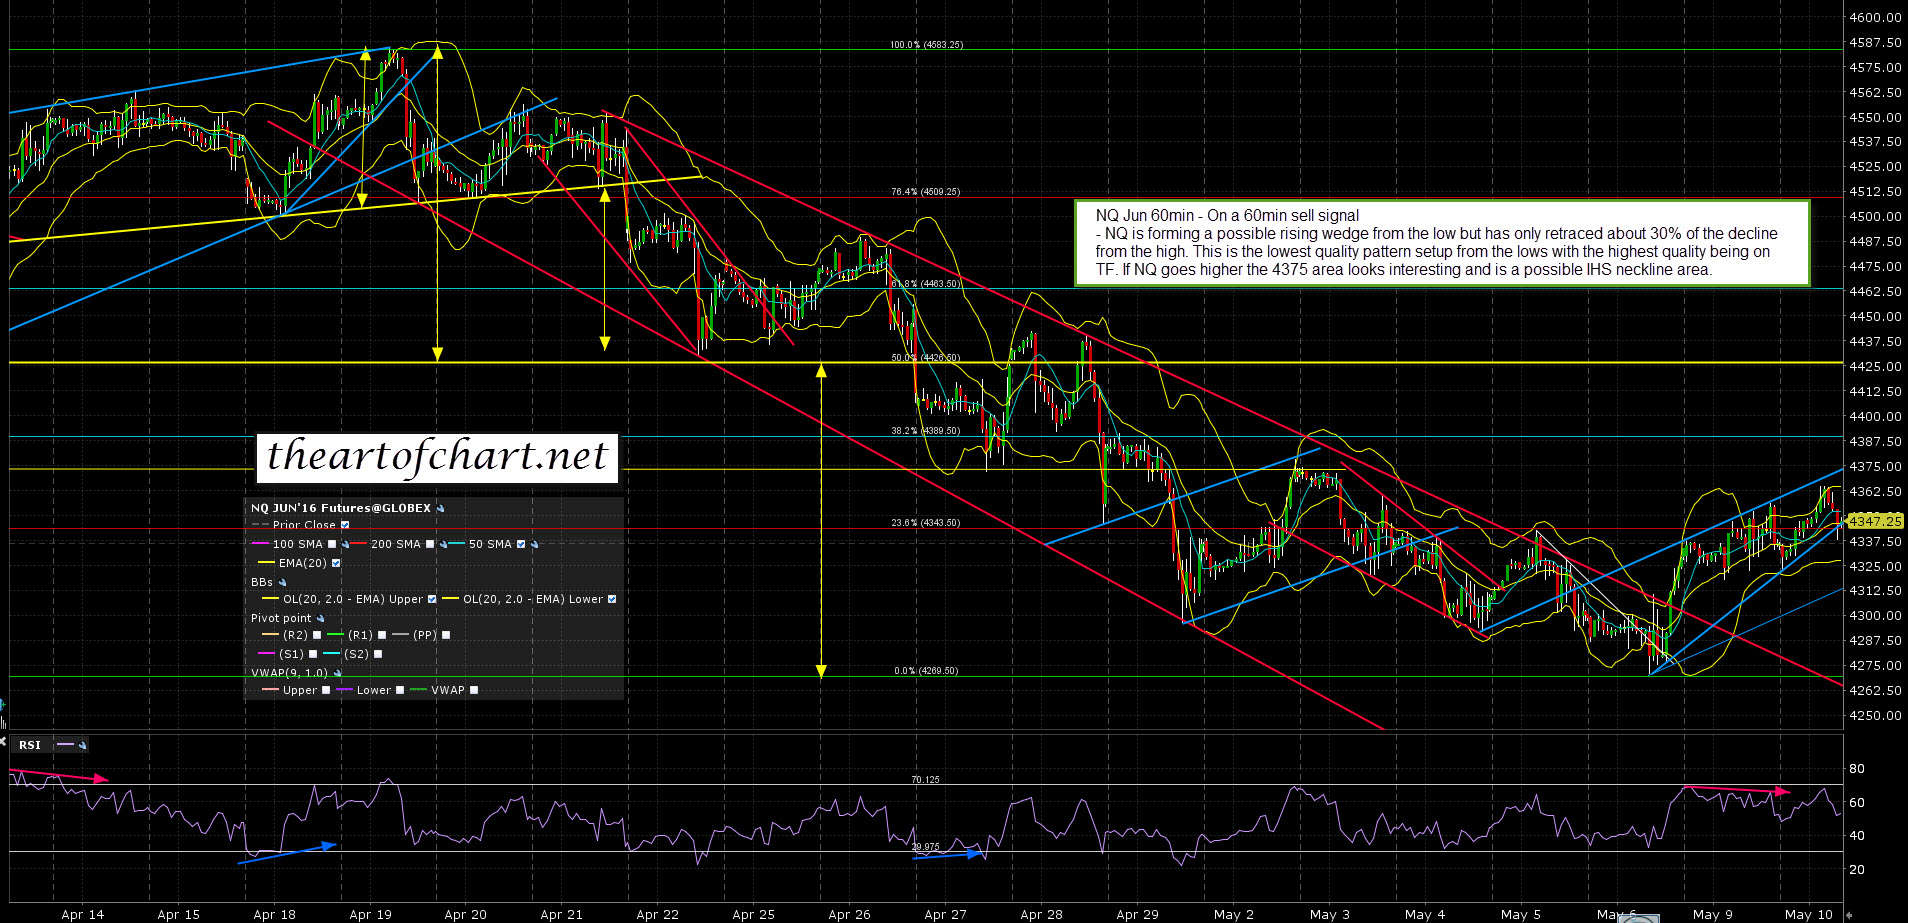
NQ has the messiest pattern setup from the low and it isn’t easy to draw any conclusions from it, though I’d note that on all three of the ES, NQ & TF charts there are possible IHS setups here that have all broken up. NQ Jun 60min chart:
Today is a cycle trend day and that gives 70% odds that the day will be directional and dominated by either the bulls or the bears. SPX and ES are now testing strong resistance at the daily middle band and if that holds as resistance then this rally is ending right here and right now, and we may well see a fast and strong rejection. If bulls can break above the daily middle band, and then hold it as support, the upside opens up, that 2090 IHS target on ES starts to look doable, and we may see a retest of the current swing high at 2111.05 SPX. We’ll see if that resistance holds.
