
I haven’t reposted the bonus charts I do every morning at theartofchart.net for a while and I’m keen to get this post out before the RTH open today so I’m posting them below. The charts are the ES, NQ, TF, DX, GC, CL & ZB charts. The NG & SB charts get added once a week but that’s on Mondays. On to the markets.
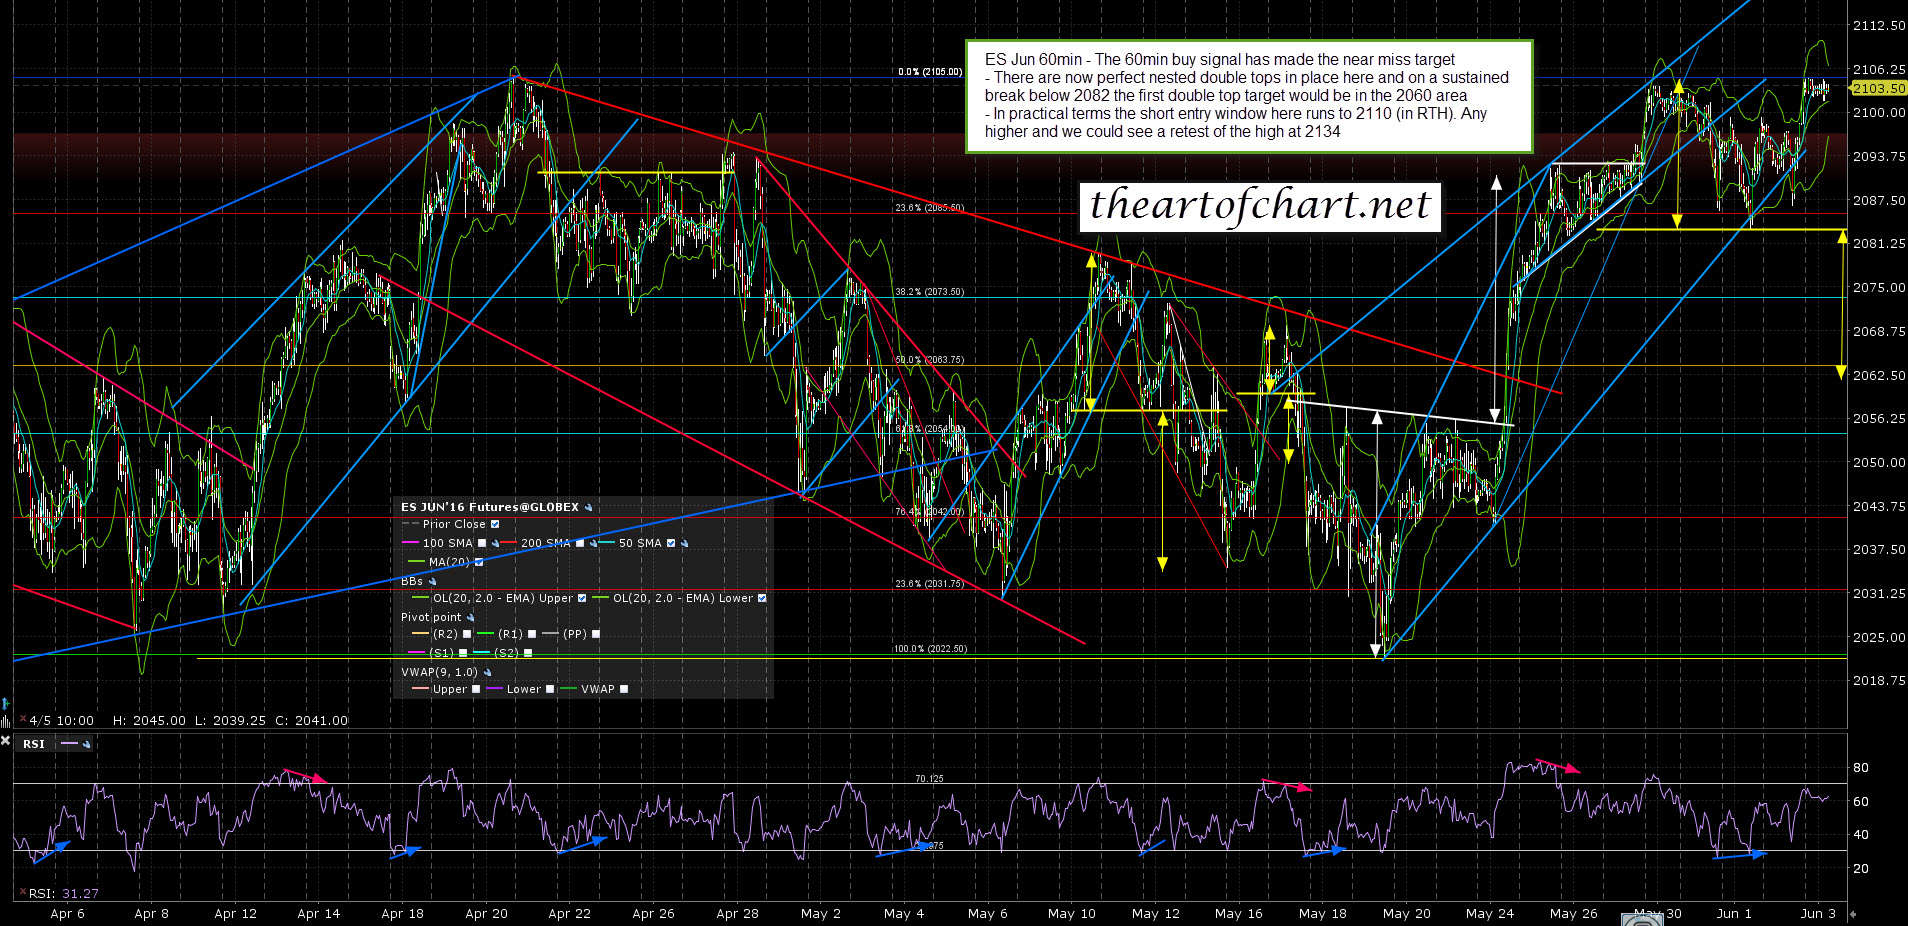
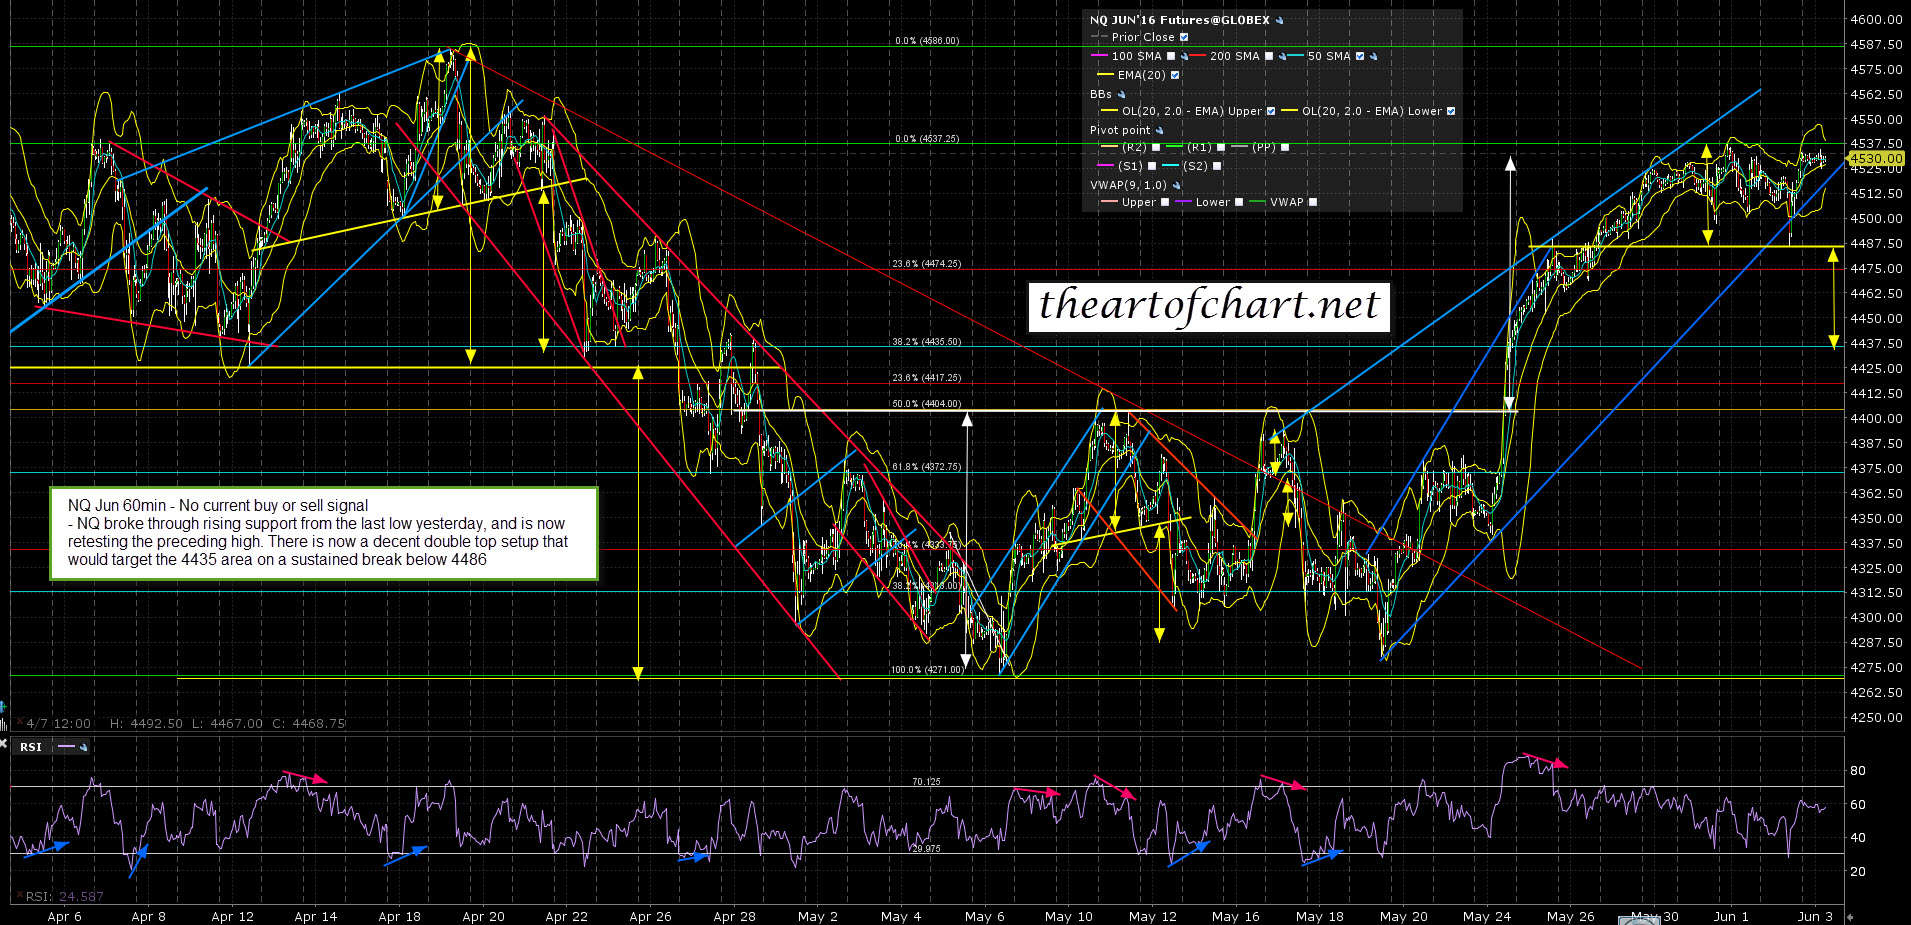
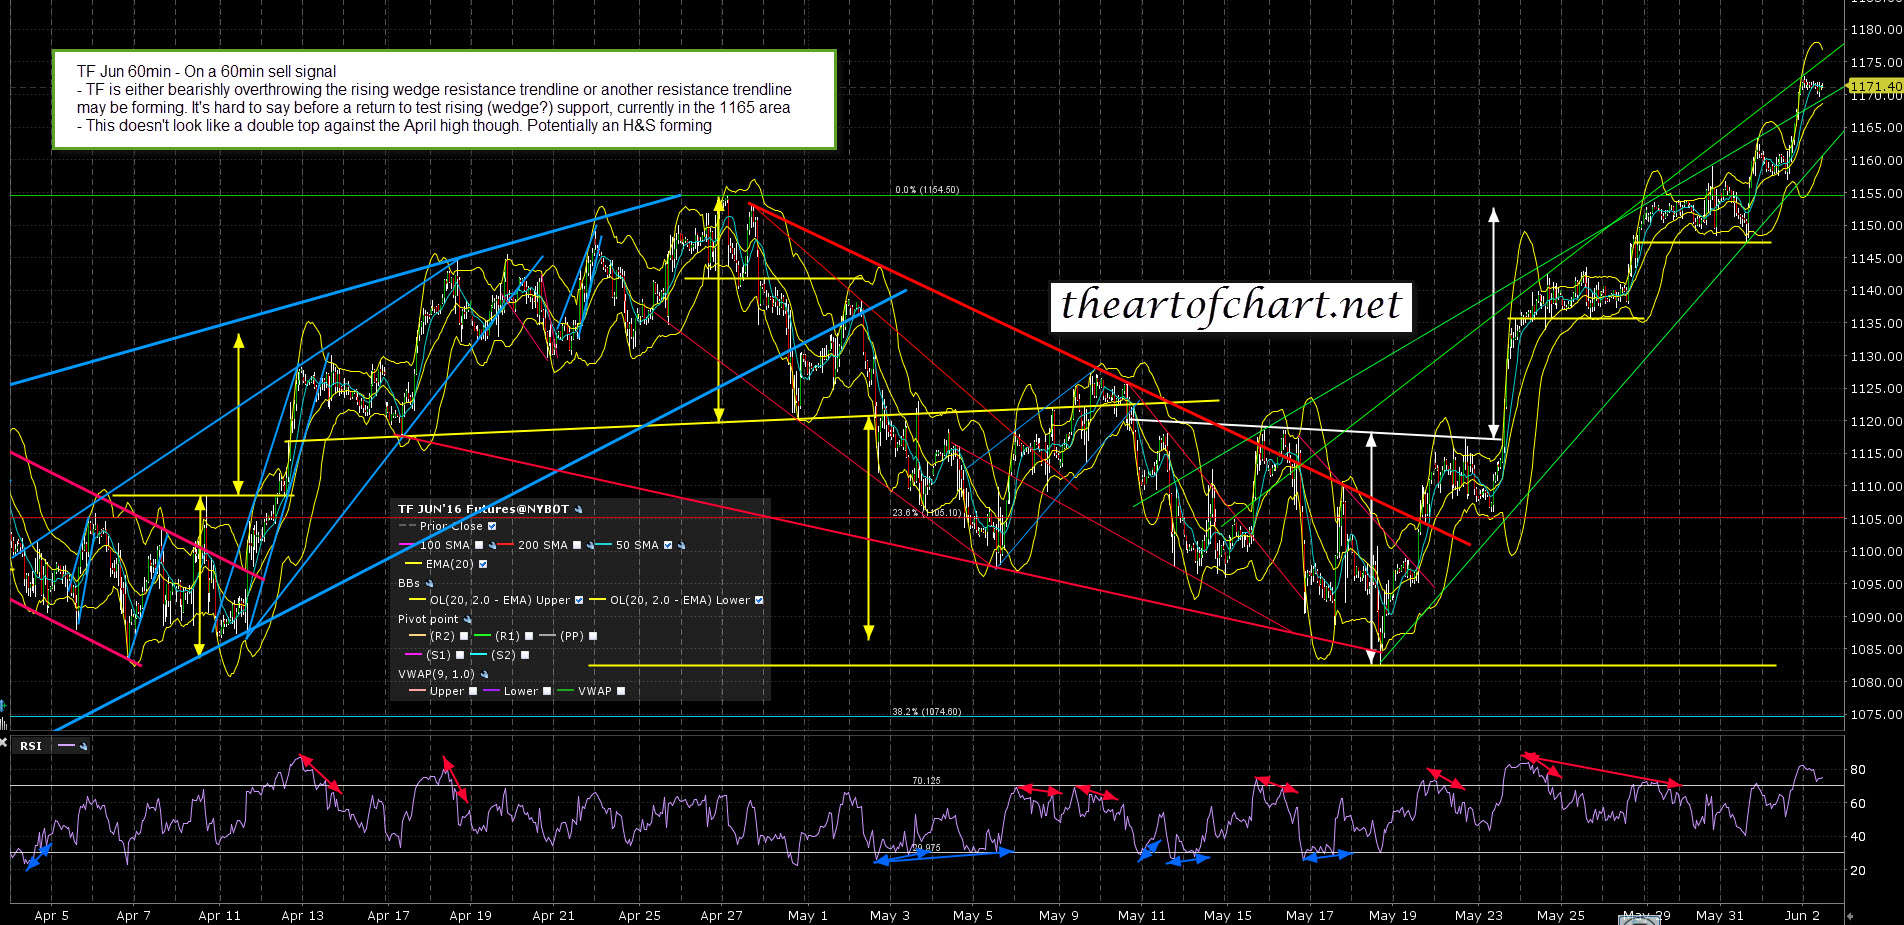
Yesterday afternoon we saw the full retest (and marginal new high) of 2103 that I was talking about on Wednesday morning and the ES 60min buy signal that I mentioned yesterday morning has now made the possible near miss target. There are now very nice looking nested double top setups on ES and NQ, though not on TF which has overshot the target area. What happens now? We shall see. NFP is about to be released as I write and the setup says down, but there’s only ever one way to find out for sure. If we see an RTH break over 2111 that would open up a possible retest of the all time high at 2134, so in the event that is broken the short setup here would look much less attractive.
ES Jun 60min chart:
NQ Jun 60min chart:
TF Jun 60min chart:
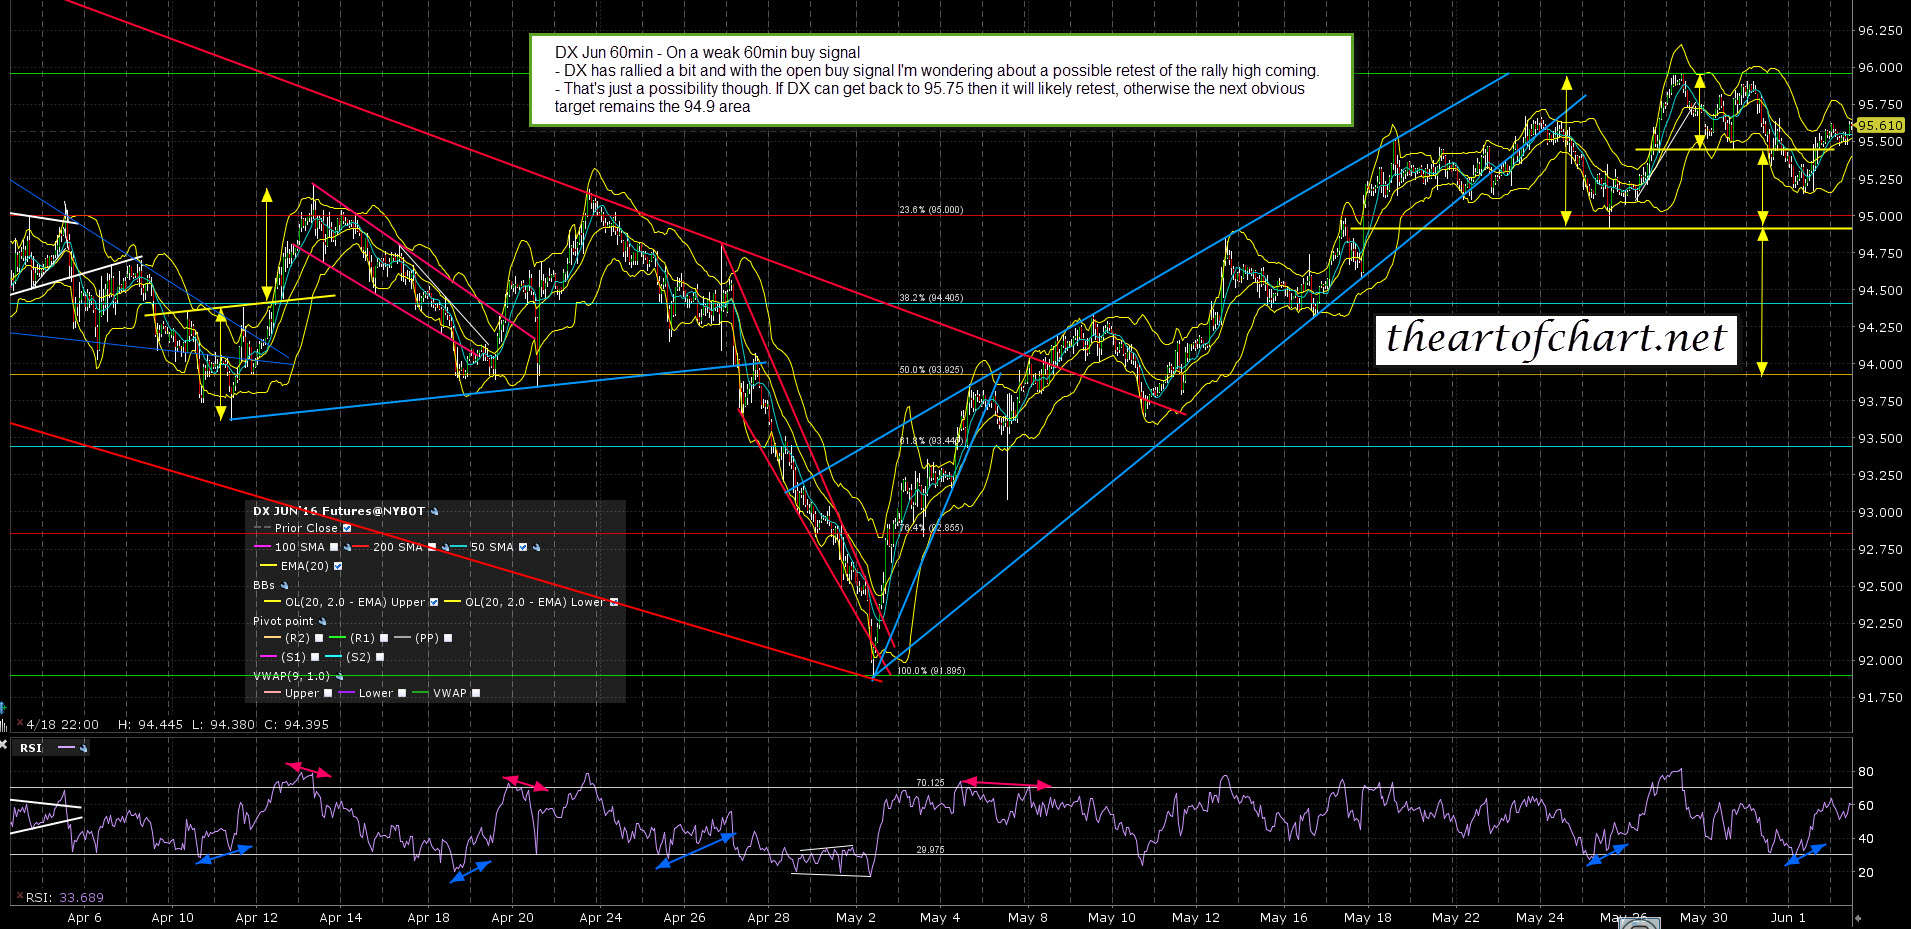
DX has made the 94.9 target and broken below it. The larger double top target is in the 93.90 area. DX Jun 60min chart:
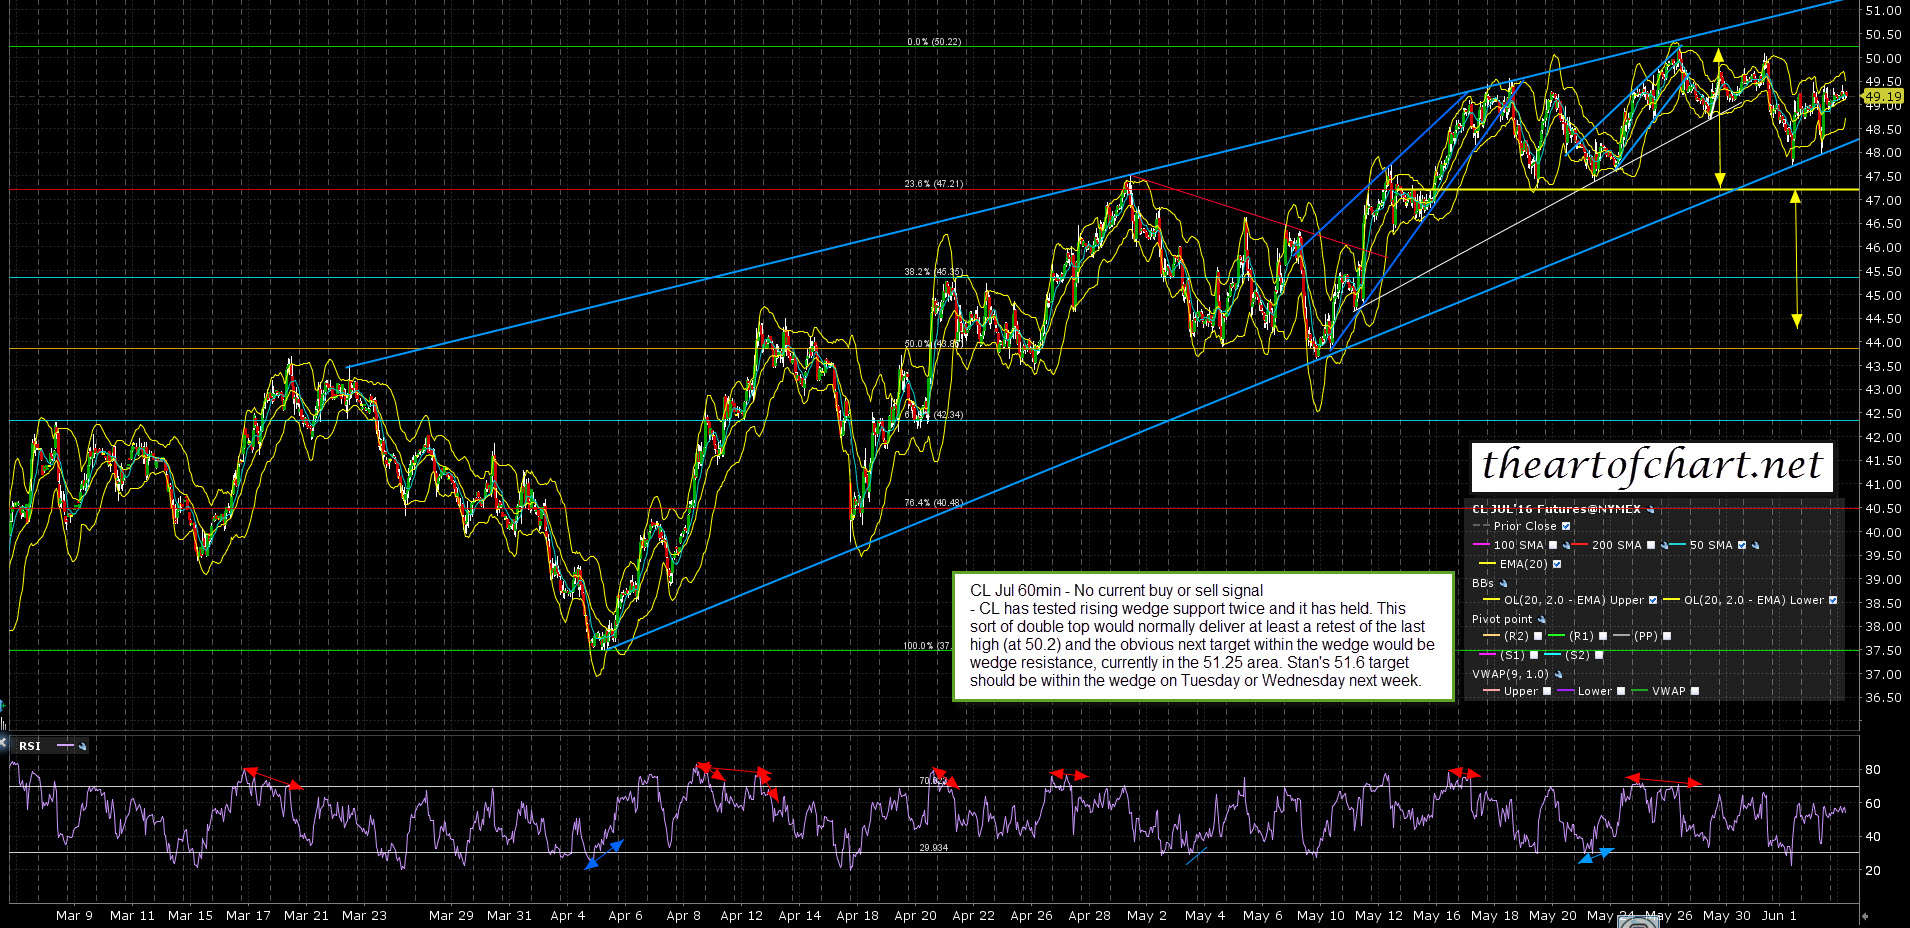
CL bull setup looks fine as long as rising wedge support (currently) in the 48.25 area holds. CL Jul 60min chart:
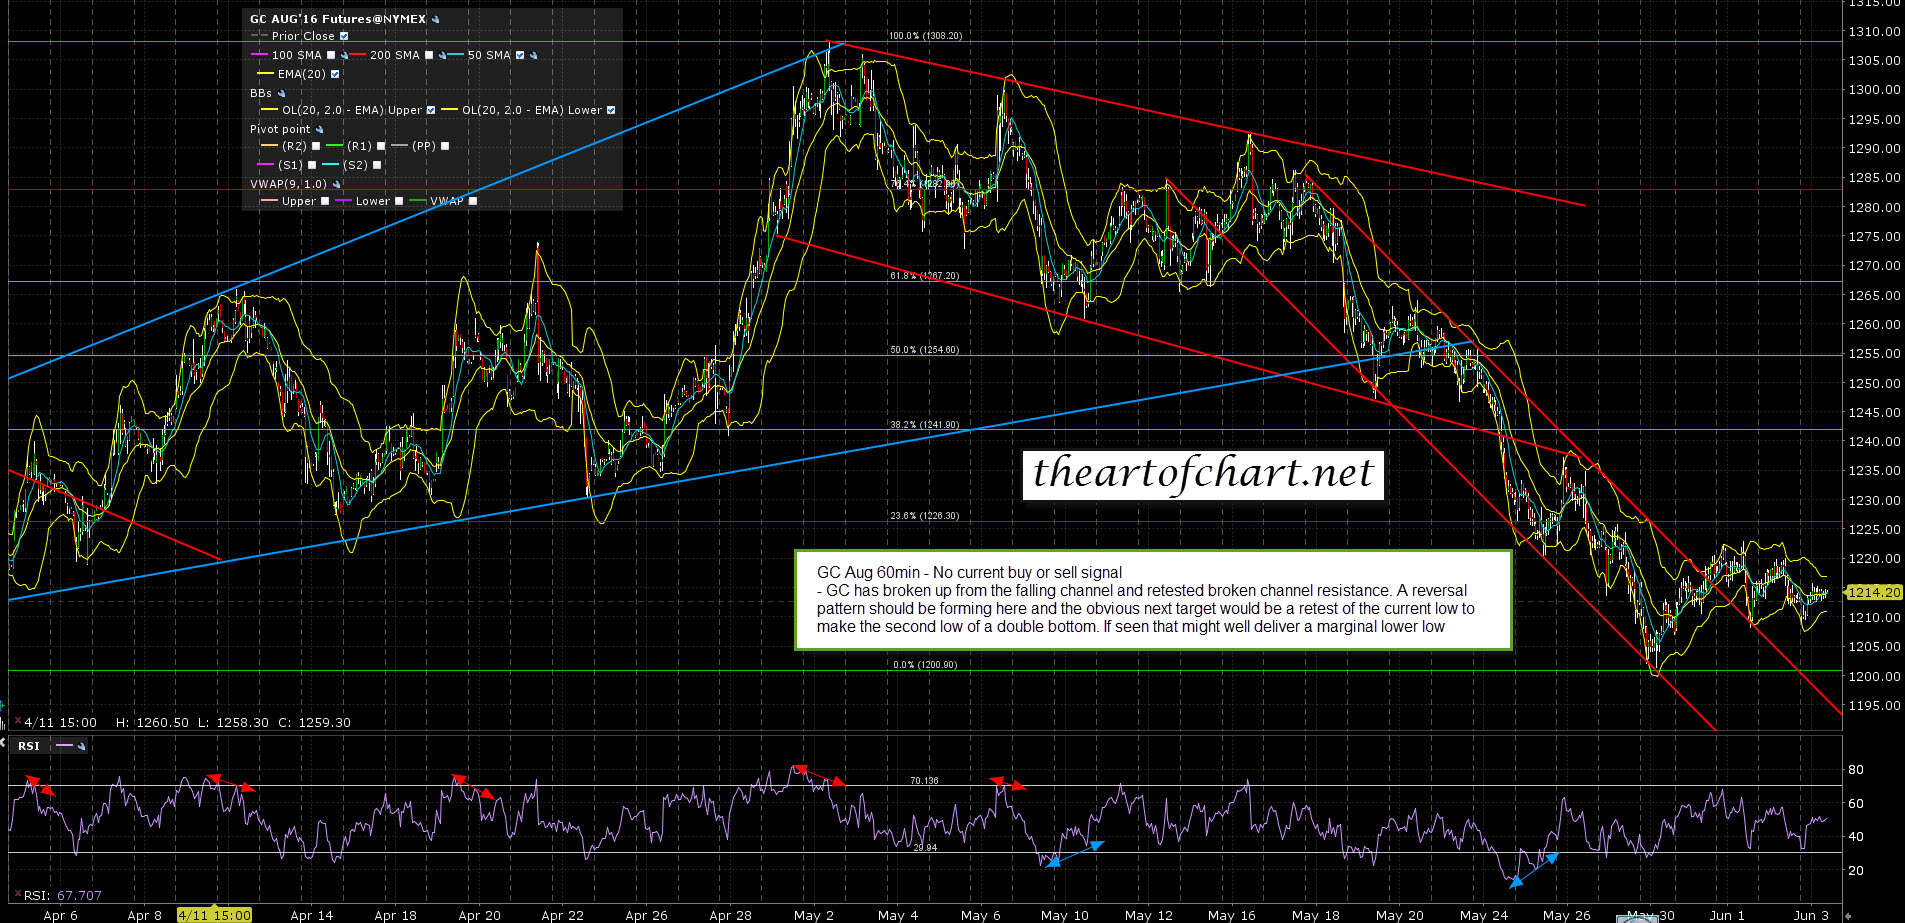
GC has broken up. Double bottom target in the 1245 area. Initial target and possible resistance areas are the 1255 and 1287 areas. GC Aug 60min chart:
ZB has broken up and made the double bottom target on NFP. ZB Sep 60min chart:

I’ve added some notes to the DX, CL, GC and ZB charts in the wake of the NFP numbers, which were obviously a miss. The bear scenario looks just fine and today is the other cycle trend day this week, so the bears may well keep control of the tape all day. Everyone have a great weekend 🙂
